![Psqi [PDF]](https://pdfs.asia/img/200x200/psqi-u64e2b165b8605.jpg)
7 0 362 KB
Received: 17 October 2018
Revised: 1 August 2019
Accepted: 2 May 2020
DOI: 10.1111/ijn.12856
ORIGINAL RESEARCH PAPER
Validity and reliability of the Indonesian version of the Pittsburgh Sleep Quality Index in adolescents Anggi Setyowati Ners, MSc, Doctoral Student1,2 1 Public Health Faculty, Universitas Airlangga, Surabaya, Indonesia 2
School of Nursing, College of Nursing, Taipei Medical University, Taipei, Taiwan, ROC 3
Department of Nursing, Shuang Ho Hospital, Taipei Medical University, New Taipei City, Taiwan, ROC Correspondence Min-Huey Chung, School of Nursing, College of Nursing, Taipei Medical University, 250 Wu-Xing Street, Taipei 110, Taiwan, ROC. Email: [email protected]
|
Min-Huey Chung RN, PhD, Professor2,3
Abstract Aim: The study aims to examine the psychometric properties of the Pittsburgh Sleep Quality Index-Indonesian version. Background: The Pittsburgh Sleep Quality Index has never been translated into Bahasa. Design: This study employs a cross-sectional and correlational study. Methods: Data were collected from 528 adolescents of junior high school age (13–16 years) during August to September 2014. All participants agreed on the Indonesian version of Pittsburgh Sleep Quality Index and Beck Depression Inventory-II. Psychometric properties were examined including internal consistency, construct validity and known group validity, and the receiver operating characteristic curve was used to measure the cut-off point. Results: The Cronbach's alpha for the Pittsburgh Sleep Quality Index-Indonesian version was adequate. There were positive correlations between the total score and seven component scores. Construct validity revealed that the total score of the Pittsburgh Sleep Quality Index-Indonesian version was correlated with the total score of the Indonesian version of the Beck Depression Inventory-II. Known group validity indicated that adolescents without depression risk had better sleep quality. According to receiver operating characteristic curve analysis, the cut-off point at a score of 6.5 indicated the best possible relationship of sensitivity and specificity. Conclusion: The Pittsburgh Sleep Quality Index-Indonesian version has high reliability and validity for screening sleep quality among adolescents. KEYWORDS
adolescent, questionnaire, sleep disturbances, sleep quality, validation
S U M M A R Y ST A T E M E N T
What this paper adds?
What is already known about this topic?
• The results support the validity and reliability of the Pittsburgh
• The original Pittsburgh Sleep Quality Index has adequate internal
Sleep Quality Index-Indonesia in screening sleep quality among
consistency and favourable reliability.
adolescents.
• It is easy for patients and health-care providers to use for inter-
• The cutoff score for the Pittsburgh Sleep Quality Index-Indonesian
preting sleep disturbances.
Int J Nurs Pract. 2020;e12856. https://doi.org/10.1111/ijn.12856
version for adolescents was 6.5.
wileyonlinelibrary.com/journal/ijn
© 2020 John Wiley & Sons Australia, Ltd
1 of 7
2 of 7
The implications of this paper:
SETYOWATI AND CHUNG
psychometric efficiency of the PSQI-I, including translation, validation, reliability and cut-off point, in assessing Indonesian adolescents.
• The cut-off point could detect poor sleep quality among Indonesian adolescents. • This simple tool is capable of quickly assessing sleep quality for
2.2 | Participants and settings
health-care providers. This study employed a cross-sectional and correlational design, using self-reported questionnaires. Data were collected from adolescents who lived at a junior high school, Darul Ulum Islamic Boarding School.
1 | I N T RO D UC TI O N
The inclusion criteria were junior high school students who lived in a dormitory and had no history of psychiatric or neurological disorders.
Sleep disturbance in adolescents is not rare (Danielsson, Harvey,
The exclusion criteria were students whose parents disapproved of
MacDonald, Jansson-Fröjmark, & Linton, 2013) and has been
their participation in this study and students who did not provide
associated with sleep quality (LeBourgeois, Giannotti, Cortesi,
informed consent. Previous study recommended that 60% response
Wolfson, & Harsh, 2005). Adolescents in Europe, Asia and the
rate (Dong & Peng, 2013). The final sample has a total of 528 adoles-
United States have multiple behaviours that influence sleep quality,
cents, with a 75% response rate.
such as difficulty going to bed, falling asleep, getting undisturbed sleep and waking up in the morning (LeBourgeois, Giannotti, Cortesi, Wolfson, & Harsh, 2004). Haryono et al. (2016) observed that
2.3 | Instruments
62.9% of adolescents aged 12–15 years who live in Indonesia, especially in East Jakarta, have sleep disorders and 72.9% have dif-
2.3.1 | Beck Depression Inventory-II
ferences in their awake and sleep times between weekdays and weekends.
The Beck Depression Inventory (BDI)-II was created by Aaron T. Beck
Poor sleep quality can affect adolescents' concentration, atten-
(Beck, Steer, & Brown, 1996). Each adolescent was assessed using the
tion, memory and physical and mental health (Suen, Tam, &
Indonesian version of the BDI-II (Indo BDI-II; Ginting, Näring, van der
Hon, 2010). Furthermore, among adolescents, poor sleep is associated
Veld, Srisayekti, & Becker, 2013). The BDI-II is a valid measure of
with emotional disturbance (Roberts, Roberts, & Chen, 2002), nega-
depression in the Indonesian general population. The BDI-II has
tive mood (Lund, Reider, Whiting, & Prichard, 2010) and depression
21 items, each scored from 0 to 3. The total score of the BDI-II ranges
(Owens & Adolescent Sleep Working Group, 2014). Adolescents are
from 0 to 63, and the cut-off point of for the Indo BDI-II is 17. It has a
often unaware that sleep disturbances influence their health. There-
high coefficient alpha (0.90). For validity, the BDI is more closely asso-
fore, an appropriate tool to measure the sleep quality among adoles-
ciated with the diagnostic criteria for depression (Beck et al., 1996).
cents is relevant to conduct rapid screening inthe clinical settings to
The convergent validity of the Indo BDI-II is acceptable (Ginting
improve sleep quality (Tzeng, Fu, & Lin, 2012). Sleep quality is a crucial factor related to sleep (Buysse, Reynolds,
et al., 2013). BDI-II had three dimensions: Items 1–3, 5–9 and 14 representing cognitive; Items 4, 10, 12 and 13 representing affective; and
Monk, Berman, & Kupfer, 1989). The quantitative aspects of sleep
Items 11 and 15–21 representing somatic (Titov et al., 2011). In this
comprise various domains such as sleep duration, sleep latency and
study, Item 21 was excluded based on suggestion made by the ethics
number of arousals, and the purely subjective aspects include the
committee and the head of the boarding school. They considered age,
depth or restfulness of sleep (Krystal & Edinger, 2008). In this study,
religion and culture that prohibited to conduct sexual activity before
the Pittsburgh Sleep Quality Index (PSQI) was used to determine self-
marriage. The Cronbach's alpha for the Indo BDI-II was 0.82 (Items
reported sleep quality and sleep disturbances for the preceding
1–20) in this study.
month. The original PSQI has adequate internal consistency and favourable test–retest reliability (Buysse et al., 1989). It is a consistent and easy for patients and health-care providers in interpreting the
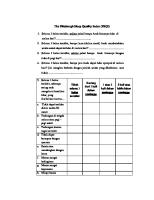
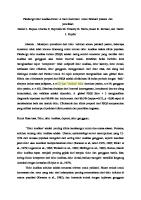
2.3.2 | Pittsburgh Sleep Quality Index
indicators of sleep quality (Buysse et al., 1989; Mollayeva et al., 2016). The PSQI was designed by Daniel J. Buysse (Buysse et al., 1989). The PSQI is used to measure self-reported sleep quality and sleep distur-
2 | METHODS
bances during the preceding month. It is a 19-item test and consists of seven components: (1) subjective sleep quality, (2) sleep latency, (3)
2.1 | Aim
sleep duration, (4) sleep efficiency, (5) sleep disturbance, (6) sleeping medication use and (7) daytime dysfunction. Each component is
The PSQI has never been translated into Bahasa, and no study has
scored from 0 to 3, and the total score ranges from 0 to 21, with a lower
been conducted to evaluate the psychometric efficiency of the PSQI-
score ( 17) and normal groups (Indo BDI-II ≤ 17) using independent sample t test. We hypothesized that adolescents with a
2.5 | Procedures
high score for depression have poor sleep quality. In addition, we used receiver operating characteristic (ROC) (de la Vega et al., 2015) analy-
Data were collected from August to September 2014. Permission to
sis to establish the cut-off point of the PSQI-I among adolescents
use the PSQI was granted by the original inventors. The final English
with and without sleep disturbance. Previous study noted that
version of the PSQI was translated into Bahasa based on the World
sleep disturbance can be assessed by sleep quality (Buysse
Health Organization guidelines (World Health Organization, 2014).
et al., 1989; Lund et al., 2010; Tzeng et al., 2012). Thus, ROC was also
The guidelines were implemented as follows:
used to measure sleep disturbance with PSQI-I. Sleep disturbance was defined as >30 min of sleep onset latency (Berger &
1. Forward translation: One expert translator who was familiar with
Higginbotham, 2000; Espie, Inglis, & Harvey, 2001), total sleep time of
the terminology of this instrument and knew English but whose
≤6.5 h (Lacks & Morin, 1992) or ≤85% sleep efficiency (Berger &
mother tongue was Bahasa translated the PSQI into Bahasa.
Higginbotham, 2000).
2. Expert panel: Two experts, namely, a mental health nurse and community nurse, reviewed the PSQI after translation into Bahasa. 3. Back translation: The instrument was translated back to English by
3 | RESULTS
a professional translator. 4. Pretesting and cognitive interviewing: A pilot study was conducted
3.1 | Description of the sample
in which 10 adolescents were recruited to examine whether the Indonesian questionnaire was easily understood by adolescents. 5. Final version.
The characteristics of the respondents are listed in Table 1. Most respondents were aged 13–14 years (87.9%). The proportion of male (53.2%) and female (46.8%) participants was almost equal. In terms of
After finalizing the questionnaire, the researcher requested the
residence, most of the respondents were from East Indonesia (88.8%).
Islamic boarding school for permission to conduct the research. After
On the basis of the Indo BDI-II, the majority of the respondents did
obtaining permission from the leader and headmaster of the school,
not have depression (70.5%), with 29.5% of the respondents having
the researcher introduced and explained the study to the participants.
depression. The total scores of the PSQI-I ranged from 2 to 16, with a
Next, informed consent forms were distributed to the participants to
mean total score of 7.25 and a standard deviation (SD) of 2.50. The
be given to their parents or guardians for approval to participate in
mean score of seven component of the PSQI-I ranged from 0.24 to
the study. The next day, participants who were granted permission by
1.50 (SD = 0.58–0.89) (Table 1).
their parents or guardians were given the research questionnaire in sealed envelopes. The participants were allowed to withdraw from the study at any time even after reading the questionnaire. After a
3.2 | Reliability
stipulated time, the participants were asked to return their questionnaires in the envelopes provided. These envelopes ensured answer
Further analyses were conducted to determine internal consistency
confidentiality.
for the PSQI-I. Cronbach's alpha for the PSQI-I was 0.72, and that for each item ranged from 0.69 to 0.72. There were statistically significant and positive correlations between the total score of the PSQI-I
2.6 | Statistical analyses
and seven component scores of the PSQI-I. The range of correlation between each domain was r = 0.36–0.56, P < 0.05.
All analyses were conducted using SPSS (Version 22) for Windows. A P < 0.05 was considered statistically significant. Descriptive statistics were used to evaluate all variables. The Cronbach's alpha for each
3.3 | Validity
item of the PSQI-I and the item-total correlations, which were calculated using the Pearson-moment correlation coefficient between
3.3.1 | Construct validity
seven component score and a total score of the PSQI-I (Kline, 1986), were used to measure internal consistency. Testing hypothesized rela-
The total score of the PSQI-I was significantly correlated with the
tionships based on a theory or previous research can be used to eval-
total score of the Indo BDI-II (r = 0.22, P < 0.05). The somatic, affec-
uate construct validity (DeVellis, 2003; Pedhazur & Schmelkin, 1991).
tive and cognitive component in BDI-II showed significant correlation
In this study, we hypothesized that depression would be negatively
with the total score of PSQI-I (r = 0.17–0.19, P < 0.05). Among seven
4 of 7
SETYOWATI AND CHUNG
TABLE 1 (n = 528)
Demographic characteristics of the participants
component of PSQI-I, sleep quality, sleep disturbances, sleep medication use and daytime dysfunction were significantly correlated with
n
Variables
%
the total score of Indo BDI-II (r = 0.11–0.25, P < 0.05) (Table 4). This supported our hypothesis that there is a correlation between depres-
Age (years)
sion and sleep quality.
13
211
40.0
14
253
47.9
15
63
11.9
16
1
0.2
Female
247
46.8
sleep quality. An independent sample t test was employed to compare
Male
281
53.2
normal and depression risk adolescents in order to develop known
469
88.8
51
9.7
8
1.5
Normal
372
70.5
Depression
156
29.5
Total
Sensitivity
1 − specificity
Specificity
Sensitivity + specificity
438
83.0
1
1.00
1.00
0.00
1.00
Gender
3.3.2 | Known group validity We hypothesized that a low score of depression indicates favourable
Residence
group validity. The total score of the PSQI-I in adolescents with
East Indonesia Central Indonesia West Indonesia BDI
Sleep disturbance Sleep onset latency, >30 min Total sleep time, ≤6.5 h Sleep efficiency, ≤85%
Total sleep time (min) Sleep efficiency (%)
T A B L E 3 Sensitivity and specificity values of the PSQI-I total score using ROC curve analysis
84
15.9
2.5
1.00
0.98
0.02
1.01
429
81.3
3.5
0.97
0.84
0.16
1.13
55
10.4
4.5
0.91
0.63
0.37
1.27
SD
5.5
0.79
0.39
0.61
1.40
Mean Total score of the PSQI-I
depression risk (Indo BDI-II > 17, n = 139; mean = 8.08, SD = 2.89)
7.25
2.50
6.5
0.66
0.26
0.74
1.41
320.89
82.24
7.5
0.49
0.21
0.79
1.28
93.06
6.51
8.5
0.32
0.12
0.88
1.20
Sleep quality
1.10
0.67
9.5
0.16
0.02
0.98
1.14
Sleep latency
1.06
0.73
10.5
0.09
0.02
0.98
1.07
Sleep duration
1.49
0.89
11.5
0.05
0.00
1.00
1.05
Sleep efficiency
0.24
0.68
12.5
0.02
0.00
1.00
1.02
Sleep disturbances
1.50
0.58
13.5
0.01
0.00
1.00
1.01
Sleep medication use
0.38
0.78
14.5
0.01
0.00
1.00
1.01
Daytime dysfunction
1.47
0.88
15.5
0.00
0.00
1.00
1.00
14.30
8.73
17
0.00
0.00
1.00
1.00
Total score of the BDI-II
Abbreviations: BDI-II, Beck Depression Inventory-II; PSQI-I, Pittsburgh Sleep Quality Index-Indonesian version; SD, standard deviation.
TABLE 2
Abbreviations: PSQI-I, Pittsburgh Sleep Quality Index-Indonesian version; ROC, receiver operating characteristic.
Correlation coefficients of the component of PSQI-I and BDI-II Somatic
Affective
Cognitive
Total score of the BDI-II
Variables
γ
P
γ
P
γ
P
γ
P
Sleep quality
0.102
0.05
0.126
0.05
0.003
>0.05
0.024
>0.05
Sleep duration
0.71
>0.05
0.084
>0.05
0.051
>0.05
0.078
>0.05
Sleep efficiency
0.87
0.05
0.035
>0.05
0.064
>0.05
Sleep disturbances
0.227