![Lecture 3 Trinity Development Theory and Singapore Economic Development [PDF]](https://pdfs.asia/img/200x200/lecture-3-trinity-development-theory-and-singapore-economic-development.jpg)
26 0 720 KB
Trinity Development Theory To explain: Why some countries develop, while some do not? What are the key ingredients of growth of the Singapore economy? Why some countries are able to have superlative economic growth rates and are able to catch up with the already developed industrial nations? Why was Singapore able to growth at superlative growth rates of around 10% in the late 1960s, 1970s, 1980s and early 1990s? Why do affluent industrial nations exhibit slow growth rates? Is Singapore’s potential growth rate slowing down? What can we do?
Trinity Development Theory (1) EGOIN Theory (2) Triple C Theory (3) S Curve Theory
EGOIN Theory E = Entrepreneurship G = Government (and the bureaucracy)
Social capital (active agents)
O = Ordinary Labour (human capital) I = Investment (physical capital) N = Natural Resources (natural capital)
(passive agents)
EGOIN Theory The higher the per capita EGOIN, the higher the level of per capita income The bigger the ∆ per capita EGOIN, the faster the growth rate of per capita income
EGOIN Theory Multi-determinant theory EGOIN are the inputs, GDP is the output “EGO” are active factors, most critical G must take on an enabling, supporting and facilitating role for E and O to function property Aptitude and attitude of government and people
I and N are passive factors
Triple C Theory Gunnar Myrdal: Circular Cumulative Causation Theory A change in one form of an institution will lead to successive changes in other institutions. These changes continue in a cycle and are cumulative in that they persist in each round. E.g. : Closing down certain lines of production in a community → reduction of employment, income and demand → affect other sectors of the economy through the multiplier effect → depressing effect on new investments, which in turn causes a further reduction of income and demand → net outward movement of enterprises and workers → fewer local taxes are collected →…
Domestic CCC
Triple C Theory Regional and global CCC Economic benefits of cultural, institutional and technological development of neighbouring and even far away countries Development in one area leads to development in another area, which in turn contributes to the development of the original area Wealth tends to create wealth and poverty tends to accentuate poverty Transmission of regional and international growth is via trade, visible and invisible trade, capital flow (particularly FDI) and the transfer of technological, institutional and management knowledge: connectivity
Triple C Theory Three growth engines International
Regional
Domestic Engine
Domestic, Regional, International
EGOIN Theory focuses on the domestic dimension of economic development (domestic engine) while Triple C Theory highlights the regional and global dimensions of economic development.
Triple C Theory: Connectivity The higher the connectivity factor, the higher the level of per capita income The bigger the ∆ in connectivity factor, the faster the growth rate of per capita income
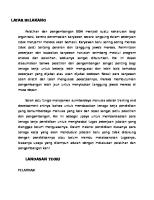
Development Stages
Japan
Stage II (Horses)
Brunei
Singapore
Hong Kong
South Korea
Taiwan
Malaysia
Stage I (Turtles)
China
Thailand
Indonesia
Philippines
North Korea
Log (GDP per Capita)
S Curve for Selected East Asian Economies Stage III (Elephants)
Three Stages of Growth Low-level Equilibrium Trap (Turtles) Superlative Growth Rate (Horses) High-level Equilibrium Trap (Elephants)
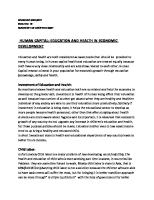
Empirical Evidence of S-Curve
Source: Phillips and Sul (2005), Economic Transition and Growth. Cowles Foundation, Yale University, Cowles Foundation Discussion Paper No. 1514.
Characteristics of the turtle, horse and elephant economies Income per capita Savings rate Investment rate Openness to trade and investment Demographic profile Investment climate Emphasis of society
Turtle Low and slowly growing Low Low Low Usually high population growth
Horse Medium and rapidly growing High High High
Elephant High and slowly growing Low Low High
Youthful, usually Aging population controlled population growth Poor Conducive Diminishing returns and rising land and labor costs Meeting basic needs Priority on economic High marginal and survival achievements propensity of leisure
Characteristics of the turtle, horse and elephant economies Entrepreneurship
Government
Turtle Poor, profusion of market-distorting government interventions Poor in both economic and political leaderships
Horse Market-oriented and entrepreneurenabling
Elephant Market-oriented and entrepreneurenabling
Good leader with Good leadership with emphasis on emphasis on social economic development development Human capital Underdeveloped Medium and rapidly High improving Fixed capital Poor infrastructures Rapidly improving Infrastructures and accumulation and low level of infrastructures and private-sector capital private-sector capital rapid increase in stock well built up accumulation private-sector capital accumulation Natural resources Not well utilized or Well utilized Well utilized lacking
Getting Old before Getting Rich
Singapore’s Economic Development
EGOIN Theory E: G:
Market-oriented pro-business stance Good public governance, efficient bureaucracy, prudent fiscal and monetary policies O: Investment in human capital EGO: Investment in social capital I: Investment in physical capital N: Capitalize on our geographical advantages
E: Market-oriented pro-business stance Minimal government intervention in goods market and labour market Making it easy for business to set up, to exit, and operate Help in facilitating domestic and international trade
2015 Doing Business Report, World Bank Singapore is the world's easiest place to do business. Ease of Doing Business Ranking Singapore
1
New Zealand
2
Hong Kong
3
South Korea
5
United States
7
Malaysia
18
Japan
29
France
31
China
90
Philippines
95
Indonesia
114 0
20
40
60
80
100
120
How Singapore ranks on Doing Business Singapore is the world's easiest place to do business.
Days Required to Start a Business, 2014 Country
Days
New Zealand Australia Hong Kong Singapore South Korea Canada Denmark Malaysia United States Switzerland Japan Germany China
0.5 2.5 2.5 2.5 4 5 5.5 5.5 5.6 10 10.7 14.5 31.4
Source: World Bank Databank
Index of Economic Freedom, 2015 Ranked 2nd freest economy out of 178 economies by the Heritage Foundation. Business freedom Trade freedom Investment freedom Fiscal freedom Monetary freedom Government spending Financial freedom Freedom from corruption Property rights Labor freedom
Rank
Country
1
Hong Kong
2
Singapore
3
New Zealand
4
Australia
5
Switzerland
6
Canada
7
Chile
8
Estonia
9
Ireland
10
Mauritius
G: Good public governance and efficient bureaucracy Global Competitiveness Report 2014-2015 by World Economic Forum ranked Singapore 2nd out of 144 countries.
Rank
Country
1
Switzerland
2
Singapore
3
United State
4
Finland
5
Germany
6
Japan
7
Hong Kong
8
Netherlands
9
United Kingdom
10
Sweden
Global Competitiveness Index (GCI) Indicator
Rank/144
Institutions
3
Infrastructure
2
Macroeconomic environment
15
Health and primary education
3
Higher education and training
2
Goods market efficiency
1
Labor market efficiency
2
Financial market development
2
Technological readiness
7
Market size
31
Business sophistication
19
Innovation
9
G: Good public governance and efficient bureaucracy Corruption Perception Index 2014 ranked Singapore 7th out of 175 countries.
Rank
Country
1
Denmark
2
New Zealand
3
Finland
4
Sweden
5
Norway
5
Switzerland
7
Singapore
15
Japan
17
Hong Kong
17
United States
50
Malaysia
100
China
G: Prudent Fiscal policies Ensure a balanced budget over the medium-term (fiscal sustainability) Government doesn’t borrow for spending purposes; returns from investment can more than cover debt servicing cost
Pursue growth and enhance competitiveness
Declining Tax Rates 60
Cut of CIT to 33%
Start of GST at 3%
GST GST at 4% at 5%
GST at 7%
50
40
30
20
10
0 1965
1970
1975
1980
1985
Corporate Income Tax Rates (%)
1990
1995
2000
2005
Top Personal Income Tax Rates (%)
2010
2015
Internationally competitive corporate income tax rate (2014) USA
40
India
34.61
France
33.33
Japan
33.06
Philippines
30
Australia
30
Germany
29.65
Malaysia
25
Indonesia
25
China
25
Korea
24.2
Global Avg
23.68
Denmark
23.5
UK
21
Thailand
20
Taiwan
17
Singapore
17
HK
16.5
Ireland
12.5 0
5
Source: KPMG
10
15
20
25
30
35
40
45
G:Prudent Monetary Policy Exchange-rate centered monetary policy BBC approach (Basket, Band, Crawl) Promoting price stability for sustained economic growth Preserving the purchasing power of S$
Low CPI Inflation
Source: IMF, WEO Apr 2015
Healthy Balance of Payments
BOP Current Account Balance as % of GDP Overall Balance as % of GDP
1965
1970
1975
1980
1985
1990
1995
2000
2005
2010
2014
-5
-30
-12
-13
0
8
16
11
22
24
20
0
10
7
5
7
14
10
7
10
18
2
O: Investment in Human Capital Investment in education Compulsory primary education Highly subsidized
Investment in adult training and retraining Skills Development Fund SkillsFuture Life expectancy at birth
Mean years of schooling
Literacy Rate
1980
72.1
4.7
..
1990
75.3
6.6
89.1
2000
78.0
8.6
92.5
2010
81.7
10.1
95.9
2014
82.5
10.6
96.7
EGO: Investment in Social Capital Promotion of ethnic harmony and religious respect Tripartism among unions, employers and government National Wages Council was set up in 1972 to formulate wage guidelines to be in line with long-term economic growth, so that Singapore’s economic and social development would not be undermined.
Strengthen rule of law and property protection
I: Investment in Physical Capital Gross capital formation (% of GDP) 21% (1965), 46%, (1982), 25% (2014) 50% 45% 40% 35% 30% 25% 20% 15% 10% 5% 0% 1965
1970
1975
1980
1985
1990
1995
2000
2005
2010
2015
N: Capitalize on our geographical advantages Capitalize on our geographical advantages to become: Shipping hub Aviation hub Logistic hub
Export of services to regional countries Tourism centre Healthcare centre Education centre
Triple C: Export-oriented industrialization Pursue export-oriented industrializing strategy Domestic Export as % of GDP 1970 1980 1990 2000 2014
31% 100% 89% 82% 70%
Encourage foreign direct investment (FDI) from multinational corporations (MNCs) via attractive tax incentives
Triple C Theory Expansion of invisible trade, i.e. tourism, consulting services, banking services, education services, etc Conducive investment climate for MNCs Expanding network of Free Trade Agreements (FTAs) To reduce barriers to trade, e.g. tariff concessions, improve market access 20 FTAs in force with 31 trading partners ASEAN (1993), Japan (2002), Australia (2003), ASEAN-China (2005, goods; 2007, services), India (2005), China (2009), ASEAN-India (2009), etc
More FTAs concluded or under going negotiation Canada, Mexico, etc
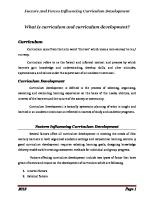
Is Singapore an Elephant Economy?
Log Per Capita Real GDP
11
10
United States
9 Singapore
8
7 1960
1965
1970
1975
1980
1985
1990
1995
2000
2005
Chow test shows that there was a structural break around 1997, indicating that Singapore has began its transformation into an elephant economy since late 1990s.
Singapore’s savings rate remained high 90
60
80 50
70 60
40
50 30
40 30
Gross Domestic Savings (current prices, billion S$)
20
20 10
10 0 1960 -10
1965
1970
1975
1980
1985
1990
1995
2000
2005
Gross Domestic Savings (% of GDP)
0 1965
1970
1975
1980
1985
1990
1995
2000
Gross Fixed Capital Formation has fallen significantly 60
50 45
50
40 40 35 30 30 20 25 10
0 1965
Gross Fixed Capital Formation (1995 prices, billion S$)
20
Gross Fixed Capital Formation (% of GDP)
15 1970
1975
1980
1985
1990
1995
2000
2005
1965
1970
1975
1980
1985
1990
1995
2000
Slowing rate of growth of capital stock and an aging population 8
12
7
11 6
5
10
4
9 3
Population Age 65 & Above (% of Total)
log of Real Capital Stock per Capita 8 1960
1965
1970
1975
1980
1985
1990
1995
2000
2005
2 1960
1965
1970
1975
1980
1985
1990
1995
2000
2005
Singapore as an incipient elephant Singapore is an incipient elephant Experience of Japan shows that transformation from a horse economy to an elephant economy is very gradual; in the case of Japan, it spanned across a period of 20 years. Pushing the envelop of growth O is the most important growth driver of high-income countries; G is the most important growth driver of the middle-income countries Diminishing returns from knowledge- and technologicaltransfer; has to increasingly reply on indigenous innovation for growth