![Tabel R Product Moment Big Sample [PDF]](https://pdfs.asia/img/200x200/tabel-r-product-moment-big-sample-q64ddf312db342.jpg)
13 0 96 KB
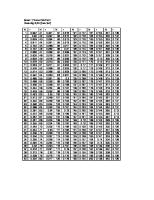
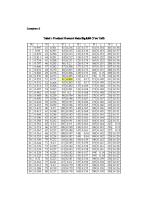
Tabel r Product Moment Pada Sig.0,05 (Two Tail) N 1 2 3 4 5 6 7 8 9 10 11 12 13 14 15 16 17 18 19 20 21 22 23 24 25 26 27 28 29 30 31 32 33 34 35 36 37 38 39 40
r 0.997 0.95 0.878 0.811 0.754 0.707 0.666 0.632 0.602 0.576 0.553 0.532 0.514 0.497 0.482 0.468 0.456 0.444 0.433 0.423 0.413 0.404 0.396 0.388 0.381 0.374 0.367 0.361 0.355 0.349 0.344 0.339 0.334 0.329 0.325 0.32 0.316 0.312 0.308 0.304
Variabel X
N 41 42 43 44 45 46 47 48 49 50 51 52 53 54 55 56 57 58 59 60 61 62 63 64 65 66 67 68 69 70 71 72 73 74 75 76 77 78 79 80
r
N 0.301 0.297 0.294 0.291 0.288 0.285 0.282 0.279 0.276 0.273 0.271 0.268 0.266 0.263 0.261 0.259 0.256 0.254 0.252 0.25 0.248 0.246 0.244 0.242 0.24 0.239 0.237 0.235 0.234 0.232 0.23 0.229 0.227 0.226 0.224 0.223 0.221 0.22 0.219 0.217
81 82 83 84 85 86 87 88 89 90 91 92 93
94 95 96 97 98 99 100 101 102 103 104 105 106 107 108 109 110 111 112 113 114 115 116 117 118 119 120
r 0.216 0.215 0.213 0.212 0.211 0.21 0.208 0.207 0.206 0.205 0.204 0.203 0.202 0.201 0.2 0.199 0.198 0.197 0.196 0.195 0.194 0.193 0.192 0.191 0.19 0.189 0.188 0.187 0.187 0.186 0.185 0.184 0.183 0.182 0.182 0.181 0.18 0.179 0.179 0.178
Variabel Y
N 121 122 123 124 125 126 127 128 129 130 131 132 133 134 135 136 137 138 139 140 141 142 143 144 145 146 147 148 149 150 151 152 153 154 155 156 157 158 159 160
r 0.177 0.176 0.176 0.175 0.174 0.174 0.173 0.172 0.172 0.171 0.17 0.17 0.169 0.168 0.168 0.167 0.167 0.166 0.165 0.165 0.164 0.164 0.163 0.163 0.162 0.161 0.161 0.16 0.16 0.159 0.159 0.158 0.158 0.157 0.157 0.156 0.156 0.155 0.155 0.154
N 161 162 163 164 165 166 167 168 169 170 171 172 173 174 175 176 177 178 179 180 181 182 183 184 185 186 187 188 189 190 191 192 193 194 195 196 197 198 199 200
r 0.154 0.153 0.153 0.152 0.152 0.151 0.151 0.151 0.15 0.15 0.149 0.149 0.148 0.148 0.148 0.147 0.147 0.146 0.146 0.146 0.145 0.145 0.144 0.144 0.144 0.143 0.143 0.142 0.142 0.142 0.141 0.141 0.141 0.14 0.14 0.139 0.139 0.139 0.138 0.138
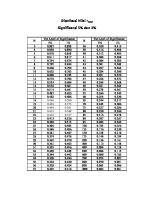
Korelasi (r) Sebelum Setelah
N 201 202 203 204 205 206 207 208 209 210 211 212 213 214 215 216 217 218 219 220 221 222 223 224 225 226 227 228 229 230 231 232 233 234 235 236 237 238 239 240
r 0.138 0.137 0.137 0.137 0.136 0.136 0.136 0.135 0.135 0.135 0.134 0.134 0.134 0.134 0.133 0.133 0.133 0.132 0.132 0.132 0.131 0.131 0.131 0.131 0.13 0.13 0.13 0.129 0.129 0.129 0.129 0.128 0.128 0.128 0.127 0.127 0.127 0.127 0.126 0.126
Sig/p value Sebelum Setelah
validasi Faktor predisposisi Perilaku mahasiswa 0,022 Faktor pemungkin Perilaku mahasiswa 0,322 Faktor pendorong Perilaku mahasiswa 0,260 Variabel X Pengetahuan
Variabel Y
Perilaku mahasiswa Sikap Perilaku mahasiswa Ketersediaan Sarana Perilaku mahasiswa Standar Operasional Perilaku mahasiswa Perilaku Kelompok Perilaku Sosial mahasiswa SSE Perilaku mahasiswa
validasi 0,184 0,440 0,223
Korelasi (r) Sebelum Setelah validasi validasi 0,009 0,010
validasi 0,835 0,002 0,011
validasi 0,132 0,000 0,067
Sig/p value Sebelum Setelah validasi validasi 0,930 0,933
0,020
0,193
0,847
0,114
0,255
0,320
0,013
0,008
0,260
0,351
0,012
0,003
0,276
0,187
0,007
0,127
0,091
0,147
0,381
0,230
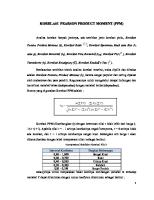
Correlations
PENGETAHU AN PENGETAHUAN
Pearson 1 Correlation Sig. (2-tailed) N 68 SIKAP Pearson -.008 Correlation Sig. (2-tailed) .945 N 68 KELOMPOKSOSI Pearson .080 AL Correlation Sig. (2-tailed) .516 N 68 SSE Pearson .111 Correlation Sig. (2-tailed) .366 N 68 KETERSEDIAAN Pearson -.068 SARANA Correlation Sig. (2-tailed) .583 N 68 SATNDAROPER Pearson -.338** ASIONAL Correlation Sig. (2-tailed) .005 N 68 PERILAKU Pearson .010 Correlation Sig. (2-tailed) .933 N 68 **. Correlation is significant at the 0.01 level (2-tailed).
PREDISPOS Pearson ISI Correlation
KELOMPOKS OSIAL
SIKAP
KETER AANSA
SSE
-.008
.080
.111
.945 68
.516 68
.366 68
1
-.094
-.176
68
.445 68
.151 68
-.094
1
.138
.445 68
68
.261 68
-.176
.138
1
.151 68
.261 68
68
.107
.213
.082
.386 68
.081 68
.508 68
.124
.374**
.166
.315 68
.002 68
.177 68
.193
.187
.147
.114 68
.127 68
.230 68
Correlations PREDISPO PEMUNGKI PENDORON PERILAK SISI N G U 1 .033 -.118 .184
Sig. (2-tailed) .791 N 68 68 PEMUNGKI Pearson .033 1 N Correlation Sig. (2-tailed) .791 N 68 68 PENDORON Pearson -.118 .391** G Correlation Sig. (2-tailed) .338 .001 N 68 68 PERILAKU Pearson .184 .440** Correlation Sig. (2-tailed) .132 .000 N 68 68 **. Correlation is significant at the 0.01 level (2-tailed).
.338 68
.132 68
.391**
.440**
.001 68
.000 68
1
.223
68
.067 68
.223
1
.067 68
68