![Us 30 [PDF]](https://pdfs.asia/img/200x200/us-30.jpg)
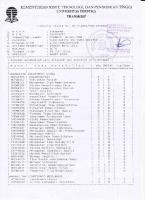
23 0 37 KB
US 30 Challenge The Forex Scalper One Team One Goal: ● stick to the plan & don’t be greedy. It will come back to bite ● Control emotions & thoughts. Don’t keep moving stop loss/end up losing more money ● Pips have no emotion-Unit of movement ● Money is emotion-everyone wants it ● Work hard for my goals. Believe I can do it because I can Ch 1: What is Forex: ● Trades 5.3 trillion a day ● 5 days a week/24hrs a day ● 4 trading zones: Sydney, Tokyo, London, NY ● open/close diff times in summer/winter ● mostly trades currencies: US dollar, EURO, Jap Yen. Most popular pair EURUSD ● Banks are biggest players in market ● Tech analysis: studying price movement of pairs/trend lines, S&R, indicators ● Fund analysis: economic news ● Swing/Trend trading: look for predictable swings, use stop loss. Stay in read as long as it’s going with the trend ● Day trading: 5-10 trades a day, usually don’t hold trades overnight, right stop loss ● Scalping: short time frame, 5-10 pips ● 3 trading charts: candlestick, line, bar ● Line chart: shows trend and S&R ● Bar chart: individual prices for certain time period. Has open, high, low, close point ● Candlestick: similar to bar but easier to read ● Fundamental indicators: increased interest rate-stronger currency, low interest rateweaker currency, production data-industrial countries, bullish if #s are higher than expected and bearish #s are lower than expected, employment data-higher #s is bullish, lower #s bearish, GDP-confirm trend that’s begun Ch 2: Technical Analysis ● Support/resistance is most common ● Support price is set lower than current price, price can hit support & go up or break through support. A good place to buy ● Resistance price is set above current price, price can hit & go down or break through the roof. A good place to sell ● Line chart: a good to see S&R ● Right zones: draw zones on the wicks ● SRB-support becomes resistance- sell setup. Keep SL small. SL 5-10 pips below zone ● RBS-resistance becomes support- buy setup ● Supply=sell ● Demand =buy ● Fresh supply zone has few candles-traffic. ● Fresher the zone the lower the risk ● 3 market structures: uptrend, downtrend, sideways
● ● ● ● ● ●
Uptrend- worth more Downtrend-lose value Sideways- prices move in narrow range H-high, HH-higher high, HL-higher low, L-low LL-lower low, LH-lower high Head & shoulders-mostly seen at highest point of upward trend. Set up to go down & repeat same pattern. 2 shoulders, head, neck. Shows weakness of a trend ● Neck-confirms a trade setup at the beginning of the neck/trend line after the 2nd shoulder has formed ● Head & shoulder above- 4 consecutive steps that signal reversal. Left should formed when a pair reaches a new high & retraces to a new low. Head is formed when a pair reaches a new HH & falls back around the level of the low formed at the left shoulder. Right shoulder is formed by a sell but not as strong as the sell that formed the head. Pair breaks above neck and creates uptrend ● Double top-uptrend at level where new highs are formed followed by pull back & retest of that same high ● Double bottom-opposite of double top ● EMA-14 & 50 ema exp. 200 ema for higher TF. look at 1,4hr & daily chart for crosses. Look for smooth & spread apart cross on 5,15 min ● Don’t enter right after cross, wait for retest & break to up/down side ● Momentum=trend strength ● Momentum-bullish uptrend ● Momentum-bearish downtrend ● Don’t trade on every TF ● Strong trend-buyers in control, shallow pull backs ● Healthy trend-buyers in control but with selling pressure ● Weak trend-buyers & sellers are going for control with buyers having slight advantage, expect steep pullbacks ● Enter trend on breakout or pullback ● Uptrend-put SL below previous low ● Downtrend-put SL above previous high ● Draw trend line by connecting lows of uptrend or highs of downtrend Ch 3 Market Manipulation ● Market manipulation-stock broker, traders, analyst, bakers manipulation to change market prices to fulfill ● Manipulation-fake news, spooking, wash trading, bear raiding ● Fake news-verify news source before trading ● Spoofing-short-time traders place orders with no intention to have them filled ● Wash trading-when big players buy & sell the same security & almost instantaneously which pumps up volume ● Bear raiding-big players force share prices lower by placing big sell orders to drop price & hit SL ● Fakeout-traps breakout traders ● Candlestick pattern change
●
Compression-emptying orders before impending news or world events that will cause big market moves-NFP or FOMC Ch 4 Japanese Candlesticks ● Comes from Japanese traders over 500 yrs ago ● Candlesticks are price action, view of current market. Easy to read & trustworthy ● Doji-small body, thin line. Same open/close price, indision candles ● Long legged, dragon fly, tombstone, 4 price ● Spinning top-small bodies, indecisive ● Hanging man-bearish candlestick pattern at end of uptrend, small body/long wick ● Hammer/pin bar-reverse signal at end of downtrend, almost no top wick, green body strong confirmation ● Shooting star-shows the end of uptrend, can set up sell trade after the close of the shooting star. Long too wick ● Tweezer top/bottom-indicates reversal soon. 1st 1 has to be in line with trend so for uptrend it’s green & 2nd 1 red, wicks have to be the same length ● Marubozu-bullish no wicks on a long body, daily & weekly TF ● Bullish engulfing candlestick-occurs at bottom of downtrend or @ consolidation support levels. Small red candle followed by big green candle, buyers take over ● Bearish engulfing candle-occurs at end of uptrend or @ consolidation resistance levels. Small green candle followed by big red candle, sellers take over ● Morning star-3 candle sticks. Starts with red candle then a doji, spinning top, or hammer/pin bar then a green candle that closes in top 40% of 1st red candle. Look for a buy trade ● Evening star-3 candles. Starts with green candle then shooting star, doji, or spinning top then a red candle that close in the bottom 40% of 1st green candle. Look for sell ● Inside candlestick formation-2 candles, 2nd candle is completely covered by shadow oh 1st candle (mother candle), good risk to reward ratio Ch 5 The Mindset ● must be smart, patient, disciplined, right mindset to be successful ● Trade with money you can afford to lose ● Don’t doubt, have faith in yourself ● Learn from mistakes ● Fear comes after a streak of losing trades, once you learn the market you have little to no fear ● Revenge-an emotion that can lead to more negative outcomes ● Greed-most dangerous of all emotions & can lead to risking more ● Risk management-no risk control leads to emotional trading. Set losing limit before trading ● Losing trades-don’t let them get to you ● Losing money-don’t pay for services or pay for other bad traders to trade for you ● Chart loonatic-keep it simple & use indicators that work for you ● Over trading-don’t trade on emotions ● Aim for the PIP not for the money, Pip goals & risks ● Must have game plan or strategy. Keep log of trades
● Trade successful in demo 3-6 months before going live. Practice makes perfect Ch 6 Trading plan ● Use SL ● Don’t open 2 trades at once ● Keep trades in notebook ● Think in terms of % & PIP ● Record every trade in spreadsheet ● Trading plan: pairs, times, entry, strategy, risk reward, goal, rules Ch 7 Check List ● Must have self control ● Control emotions & temptation ● Be consistent ● Dont’s:trade too big lot sizes, replace SL, open too many trades, over leverage, keep trades open too long ● Set monthly goals, don’t let losses Bring you down ● The best way to predict my future is to create it!