![(Analytical Profiles of Drug Substances 12) Klaus Florey (Eds.) - Academic Press (1983) PDF [PDF]](https://pdfs.asia/img/200x200/analytical-profiles-of-drug-substances-12-klaus-florey-eds-academic-press-1983-pdf.jpg)
5 0 23 MB
Analytical Profiles of Drug Substances Volume 12 Edited by
Klaus Florey The Squibb Institute for Medical Research New Brunswick, New Jersey
Contributing Editors
Abdullah A. Al-Badr Norman W. Atwater Steven A. Benezra
Glenn A. Brewer, Jr. Hans-Georg Leemann Joseph A. Mollica
Compiled under the auspices of the Pharmaceutical Analysis and Control Section APhA Academy of Pharmaceutical Sciences
ACADEMIC PRESS
1983
A Subsidiary of Harcourt Brace Jovanovich, Publishers
Paris
San Diego
New York London San Francisco Silo Paulo Sydney Tokyo Toronto
EDITORIAL BOARD Abdullah A. Al-Badr Norman W. Atwater Steven A. Benezra Rafik Bishara Gerald S. Brenner Glenn A. Brewer, Jr. Nicholas DeAngelis John E. Fairbrother
Klaus Florey Salvatore A. Fusari Lee T. Grady Boen T. Kho Hans-Georg Leemann Joseph A. Mollica James W. Munson Milton D. Yudis
Academic Press Rapid Manwrcript Reproduction
COPYRIGHT
@ 1983, BY T HE AMERICANP HARMACE U TI C A L
ASSOCIATION ALL RIGHTS RESERVED. NO PART OF THIS PUBLICATION MAY BE REPRODUCED OR TRANSMITTED IN ANY FORM OR BY ANY MEANS, ELECTRONIC OR MECHANICAL, INCLUDING PHOTOCOPY, RECORDING, OR ANY INFORMATION STORAGE AND RETRIEVAL SYSTEM, WITHOUT PERMISSION IN WRITING FROM THE PUBLISHER.
ACADEMIC PRESS,INC. 111 Fifth Avenue, New
York. New York 10003
United Kingdom Edirion published by ACADEMIC PRESS, INC. ( L O N D O N ) LTD. 24/28 Oval Road, London NW17DX
LIBRARY OF
CONGRESS CATALOG CARD
NUMBER:70-187259
ISBN 0-12-260812-7 PRINTED IN THE UNITED STATES OF AMERICA
83 84 85 86
9 8 7 6 5 4 3 2 1
AFFILIATIONS OF EDITORS, CONTRIBUTORS, AND REVIEWERS
H. Y. Aboul-Enein, King Saud University, Riyadh, Saudi Arabia S. Ahuju, Ciba-Geigy Corporation, Summit, New Jersey A. A. Al-Budr, King Saud University, Riyadh, Saudi Arabia S. L. Ali, Zentrallaboratorium Deutscher Apotheker e.V., Eschborn Germany N. Atwuter, E. R. Squibb & Sons, Princeton, New Jersey G. Atzl, Sandoz Ltd., Basel, Switzerland S. A. Benezru, Wellcome Research Laboratories, Research Triangle Park, North Carolina R. Bishuru, Lilly Research Laboratories, Indianapolis, Indiana D. Both, The Squibb Institute for Medical Research, New Brunswick, New Jersey G. Brenner, Merck Sharp & Dohme Research Laboratories, West Point, Pennsylvania G. A. Brewer, The Squibb Institute for Medical Research, New Brunswick, New Jersey R. D. Brown, Bristol Laboratories, Syracuse, New York 2. L. Chung, Abbott Laboratories, North Chicago, Illinois J. Cohen, Ciba-Geigy Corporation, Summit, New Jersey N. DeAngelis, Wyeth Laboratories, Philadelphia, Pennsylvania R. Dowse, Rhodes University, South Africa J. Fuirbrother, Stiefel Laboratories Ltd., Sligo, Ireland E. Felder, Bracco Industria Chimica S.p.a., Milan, Italy K. Florey, The Squibb Institute for Medical Research, New Brunswick, New Jersey S. A. Fusuri, Warner-Lambert Research Institute, Morris Plains, New Jersey L. T. Grady, The United States Pharmacopeia, Rockville, Maryland J. M. Huigh, Rhodes University, South Africa S.A. Hunnu, Bristol Laboratories, Syracuse, New York M. M.A. Hassun, King Saud University, Riyadh, Saudi Arabia I. Kunfer, Rhodes University, South Africa vii
viii
AFFILIATIONS OF EDITORS, CONTRIBUTORS, AND REVIEWERS
T. I . Khalifu, King Saud University, Riyadh, Saudi Arabia B. T. Kho, Ayerst Laboratories, Rouses Point, New York J . Kirschbuum, The Squibb Institute for Medical Research, New Brunswick, New Jersey H . G . Leemann, Sandoz Ltd., Basel, Switzerland M. A. Loutfy, King Saud University, Riyadh, Saudi Arabia J . R. Luch, Ciba-Geigy, Suffern, New York J . B. Martin, Abbott Laboratories, North Chicago, Illinois J . P. McGrot-y, Bristol Laboratories, Syracuse, New York J . Mollicu, Ciba-Geigy Corporation, Summit, New Jersey P. M. Monteleone, Bristol Laboratories, Syracuse, New York N . Muhammed, Bristol Laboratories, Syracuse, New York F. J . Miihtudi, King Saud University, Riyadh, Saudi Arabia J . W. Munson, The Upjohn Company, Kalamazoo, Michigan F. Nuchtmann, Sandoz Ltd., Bade, Switzerland G. R. Padmanabhan, Ciba-Geigy Corporation, Suffern, New York D. Pitre, Bracco Industria Chimca S.p.a., Milan, Italy A. Post, Smith Kline & French Laboratories, Philadelphia, Pennsylvania W. D. Roth, Sandoz Ltd., Basel, Switzerland R. S. Suntoro, * Smith Kline & French Laboratories, Philadelphia, Pennsylvania M. D. Yudis, Schering-Plough, Inc., Bloomfield, New Jersey
*Deceased
PREFACE
The compilationofAnalytica1Profiles of Drug Substancesto supplementthe information contained in the official compendia is now a well-established activity. That we are able to publish one volume per year is a tribute to the diligence of the editors to solicit monographs and even more so to the enthusiastic response of our authors, an internationalgroup associated with pharmaceutical firms, academic institutions, and compendia1authorities. I would like to express my sincere gratitude to them for making this venture possible. Over the years, we have had queries concerning our publication policy. Our goal is to cover all drug substances of medical value, and therefore, we have welcomed any monographs of interest to an individual contributor. We also have endeavored to solicit profiles of the most useful and used medicines, but many in this category still need to be profiled. In the preface to the eleventh volume. I announced that we would try to supplement previously published profiles with new data. Unfartunately, most of the original contributors are no longer available to undertake this task, and it has proven to be difficult to find other volunteers. We shall continue to pursue the updating program, but it will not be as comprehensive as originally envisioned. Again, I would like to request of all those who have found these profiles useful to contribute monographs of their own. We, the editors, stand ready to receive such contributions.
ix
AMANTADINE Joel Kirschbaum 1. Introduction 1.1 History, Therapeutic Use, and Mechanism of Action 1.2 Nomenclature, Molecular Weight, and Structure 1.3 Appearance, Color, Odor, and Precautions 1.4 Synthesis 1.5 Reactions, Stability, and Metabolism 2. Physical Properties of Crystalline Amantadine 2.1 Single Crystal X-Ray Diffraction 2.2 X-Ray Powder Diffraction 2.3 Mass Spectrometry 2.4 Infrared Spectrometry 2.5 Electron Tunnelling and Photoelectron Spectrometry 2.6 Thermal Analysis 2.7 Microscopy 2.8 Surface Area 2.9 Hydration 2.10 Polymorphism 3. Spectrometryof Amantadine in Solution 3.1 Nuclear Magnetic Resonance Spectrometry (NMR) 3.2 Ultraviolet Spectrometry 1. Bulk Solution Properties 4.1 Solubilitiesin Aqueous and Nonaqueous Solvents 4.2 Ionization 4.3 Dipole Moments 4.4 Hydrodynamic Properties 5. Methods of Analysis 5.1 Compositional Analysis 5.2 Identity and Colorimetric Methods 5.3 Titration 5.4 Spectrometry 5.5 Gas-Liquid Chromatography 5.6 Thin-Layer Chromatography 5.7 High-Performance Liquid Chromatography 5.8 Electrochemistry 5.9 Fluorescence Spectrometry 5.10 Tissue Culture 5.11 Comparison of Methods References
ANALYTICAL PROFILES OF DRUG SUBSTANCES VOLUME 12
1
2 2 2 2 4 5 6 6 7 9 9 11 13 13 13 13 13 14 14 16 16 16 18 19 19 20 20 20 21 21 22 22 22 22 29 30 30 31
Copyright by the American Pharmaceutical Arwriation. ISBN 0-12-260812-7
JOEL KIRSCHBAUM
1.
Introduction 1.1
History, Therapeutic Use and Mechanism of Action
Amantadine is an orally active antiviral agent It was discovered by workers at DuPont via an (3). Other than empiric screening program vaccination, it is the only prophylactic drug presently useful against many viral infections, especially influenza A and C. Once administered, its effect is immediate to reduce signs of infection among 50% to 70% of individuals exposed to the virus. A use panel recommended ( 4 ) it for individuals with a high risk of serious morbidity or mortality due to cardiovascular, immunodeficiency, metabolic, neuromuscular or pulmonary diseases, the elderly, and the unvaccinated and the important (5). It is 91% effective in preventing influenza. The antiviral activity of amantadine hydrochloride appears at an early phase of the infection (6). The mode of action appears to be the inhibition of the uncoating of the virus ( 7 ) once it has penetrated the host cell. Such a failure prevents replication. Gene 7 , coding for the virus matrix protein, carries the property of amantadine resistance ( 8 ) , and can be transferred by It was recombination between influenza viruses. that other highly symmetrical conjectured (9) hydrocarbons, perhaps in the shapes of the Platonic solids like cubane and dodecahedrane, when derivatized like amantadine, might have similar properties to pass through the membrane of a cell and destroy virus particles inside it (10). Amantadine is also useful in treating This use was found by a Parkinson's disease (2). chance observation of a significant improvement in such a patient taking 200 mg of amantadine daily for flu prophylaxis. It also appears clinically effective in the treatment of drug-induced extrapyramidal symptoms (11). Amantadine relieves Parkinson's disease (including drug-induced Parkinsonism by neuroleptics) , apparently by a mechanism involving indeed, amantadine enhances L-dopa dopamine (12); activation (2). As expected, various investigators found amantadine to have other uses; not only against other (1,2).
3
AMANTADINE
viruses (12), but also in treating cancer (13), aiding priapus (14), and inhibiting rust (15). Rimantadine, an amino group analogue [1-(1-aminoethyladamantane)] is also active against virus (2,16). Rimantadine is 4-8 times more effective than amantadine hydrochloride to protect against influenza A virus infection, but it is more toxic (17). 1.2
Nomenclature, Molecular Weight and Structure
Amantadine hydrochloride is the United States adopted name (18). The preferred chemical name is tricyclo r3.3.1. 13'7]decan-l-amine, hydrochloride. Other names include 1-adamantanamine hydrochloride, hydrochloride, 1-aminotricylo [ 3 . 3 . 1 . I. "1 decane 1-adamantylamine hydrochloride, adamantylamine hydrochloride, and 1-aminoadamantane hydrochloride, and, less correctly, midantane and dimantane hydrochloride (19). Its molecular weight is 187.71 daltons. Amantadine hydrochloride was given the chemical abstracts service systematic number 665-66-7 ; the free base, amantadine , was numbered It is currently marketed under the CAS-768-94-5. name Symmetrel (Endo Laboratories). Other names include EXP-105-1, Mantadix, Matadan, Mydantan and Virafral. In Wiswesser notation it is L66 B6 A B- C 1B ITJ BZ &GH. Amantadine hydrochloride can be represented a variety of ways, as shown below: Amantadine hydrochloride possesses a unique, rigid, relatively unstrained ring system that is composed of three fused cyclohexane rings in the chair conformation (20). Amantadine is considered to be the smallest repeating unit of the diamond lattice (21). The symmetrical cage structure causes the infrared, nuclear magnetic resonance and mass spectra to be comparatively simple, 2s will be illustrated later. As expected from this lack of asymmetry, there is no observable optical rotation (22) using the D lines of sodium, at a concentration of 1% in water. 1.3
Appearance, Color, Odor and Precautions
Amantadine hydrochloride is a white, odorless, free-fl owing crystalline powder. No precautions are given for this relatively non-toxic compound.
JOEL KIRSCHBAUM
4
ia
HCH 5 4
7
5
1.4
NH2 HCI 10
Synthesis
Adamantane is found naturally at low concentrations (approximately 0.02%) in various petroleum fractions (23). However, it may be synthesized by isomerization of ten carbon cyclic hydrocarbons, the probable basis of the naturally formed adamantane. A convenient starting material, dicyclopentadiene (I) was hydrogenated quantitatively endo-trimethylnorbornane (11, to endo-tetrahydrodicyclopentadiene). After refluxing overnight with such Lewis acids as aluminum trichloride or tribromide, adamantane (111) was found. The possible mechanism (24) is shown below. Bromination to 1-bromoadamantane, an ionic process, can he followed by a sequence of reactions with either ammonia, methylcyanide, urea or thiourea as sources of the amino group, to give amantadine (25-30). More complicated reactions of the l-bromocompound involve dehalogenation, reaction with methylcyanide and saponification (31,32). Other syntheses utilize the 1-carboxylic acid (33) and the 1-nitrate (34).
3
5
AMANTADINE
Direct amination (35) of adamantane introduction of a source of an amino group during rearrangement of I1 (also known tricyclo[5.2. 1.02,6]decane) gives a yield of amantadine (36) The reaction precedes (37) bridgehead carbon via + ~j NC12 )NC12 +H+ -Cl+
>
*
or the as 75% the
pH*.
Various other combinations of isomerization and conversion to amantadine have been described (38,39). Amantadine can also be synthesized by the photochemical reaction of chloramine with adamantane (40).
I
&-
II
&+-&+
&
F( + "RH
m 1.5
Reactions, Stability and Metabolism
Possible reactions are substitution at the amino group of amantadine, replacement of the amino group, rearrangement of the cage structure or replacement of the cage hydrogens, and have been discussed elsewhere (20). A vast number of derivatives of the amino group have been prepared (41). The amino group can undergo all of the typical reactions of primary amines, such as Schiff base formation (42), alkylation (43,44), halogenation (45) and amination (46). Deamination with sodium nitrite and acetic
JOEL KIRSCHBAUM
6
acid or nitrous acid gives 1-hydroxyadamantane in 97% yield (20). The in situ reaction with trichloroacetyl isocyanate in NMR tubes was used to analyze for the amino function ( 4 7 ) . As expected, various compounds like acid chlorides were reacted with amantadine ( 4 8 , 4 9 ) to create potential drugs with new properties. The relative stability of the 1-adamantyl cation ( 5 0 ) permits conversion of the amino group to nitro, and then to a large series of derivatives ( 5 1 ) . The cage structure can be rearranged ( 5 2 ) in a reversal of the synthesis. The cage hydrogens can be replaced by fluorine, as induced by light ( 5 3 ) or by perfluoridation ( 5 4 ; 19F-NMR, infrared and mass spectra discussed), as well as by tritium ( 5 5 ) . The amantadine structure has been characterized as being extremely stable, as predicted from the equatorial position of the amino group and the facile rearrangement of ten carbon hydrocarbons to adamantane ( 2 0 ) After oral administration, amantadine was found in the heart, kidney, liver and lungs ( 5 6 ) . Concentration of the drug in the lungs may be part of its prophylactic action. After an oral dose of 2.5 mgfkg, maximum concentration of 0 . 3 ug/mL was reached in 1-4 hours ( 5 7 ) , with a plasma half-life of 9-15 hours ( 5 8 ) . The rate of excretion depends of the pH of the urine; i . e . , at pH 5 . 0 , 5-7% per hour of body content was excreted, but at pH 8 the excretion rate was 4% per hour ( 5 9 ) . As expected, with patients having negligible renal function, excretion was impaired, with plasma concentrations reaching 4 . 4 UgfmL, and accompanied by toxic manifestations of the drug (60). In hepatic micro soma1 preparations, N-hydroxy-1-aminoadamantane and 1-nitrosoadamantane were identified as metabolites (61). Approximately 0.1% of the administered amantadine was found in urine in the form of 1-amino-3-hydroxyadamantane
.
(62). 2.
Physical Properties of Crystalline Amantadine 2.1
Single Crystal X-Ray Diffraction
Although the x-ray structure of amantadine hydrochloride was not determined, the structure of the parent compound adamantane was elucidated (63).
I
AMANTADINE
The three-dimensional representation below reproduced with the permission of C r y s t a l l o g r a p h i c Data C e n t r e , Cambridge ( 6 4 ) .
is the
E l e c t r o n d i f f r a c t i o n d a t a (65) f o r adamantane a g r e e d w i t h t h e x-ray c r y s t a l l o g r a p h y . The band l e n g t h of C-H and C-C (1.54 t 0.01A) a p p e a r normal, and t h e C-C-C a n g l e s a r e t e t r a h e d r a l (109.5 +- 1.5O). 2.2
X-Ray Powder D i f f r a c t i o n
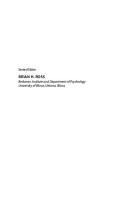
To observe x-ray d i f f r a c t i o n p a t t e r n s , a P h i l i p s powder d i f f r a c t i o n u n i t e m i t t i n g CuKa r a d i a t i o n a t 1.54A was used w i t h a s c i n t i l l a t i o n c o u n t e r d e t e c t o r (66). The r e l a t i v e l a c k of peaks s e e n i n F i g u r e 1 w a s e x p e c t e d from t h e h i g h l y symmetrical s t r u c t u r e of amantadine h y d r o c h l o r i d e . Below a r e t h e s o r t e d d a t a 1.00 u s i n g CuKa based on h i g h e s t i n t e n s i t y of radiation.
20(Degrees) 18.2 15.9 27.4 14.4 23.9
' d'
(Angstroms) 4.88 5.58 3.26 6.17 3.72
R e l a t i v e Area 1.000 0.739 0.499 0.405 0.344
Figure 1. Powder X-Ray Diffraction Pattern of Amantadine Hydrochloride.
See Text for Details
9
AMANTADINE
18.6 9.0 2.3
4.78 9.81
0.298 0.235
Mass Spectrometry
The mass spectrum (67) of amantadine hydrochloride (Figure 2) shows that the amino substituent was present as a major ionic species (68). The molecular peak was at m/e 151, with an Below is the intensity as great as 60% (69). suggested fragmentation pathway (62).
Secondary ion mas? spectrometry $70) using adducts. silver showed (M + H) and (Ag + M) Protonated amfntadine gave rise to the fragment ion ( M + H - NH3) Mass spectrometry combined with gas chromatography has been used to determine amantadine in biological tissues and fluids, cf. section 5.5.
.
2.4
Infrared Spectrometry
Figure 3 shows the infrared spectra of a commercial preparation of amantadine hydrochloride using mineral oil and potassium bromide (71). The instrument used was a Perkin-Elmer Model 983 Fourier transform infrared spectrometer. The minor differences in band intensities of the two spectra could be due to either pressure effects in the preparation of the potassium bromide pellet or
10
JOEL KIRSCHBAUM
5765 Q D Q M R N T R N R M I NE . H C L ( FlLClR I Cli 1 205C
90> t-
v)
8070-
Z
60Z H
W
>
+
a DL
50-48.-
3020100-
T F V
3
D d
INTENSITY Figure 2:
r
l
d
r
-
i
d
M F1 SS1'C H FIR C;E SUM =56750 BFISE PERK % = 1 3 . 4 4
Mass Spectrum of Amantadine Hydrochloride, Instrument AEI-MS 902.
11
AMANTADINE
polymorphism. Below are the interpretations (71, 72) aof the absorbances of these relatively featureless specra. Assignment
Ab sorption ( cm- I )
3000 2923 2855 2700-2250 2000 1600 1500 1452 1365 1307 1300 and below a
+ NH3 stretching (broad)
CH stretching (antisymmet ric) CH2 stretching (symmetric) 2+ stretching NH3+ NH3+ overtones NH3+ deformation NH3 deformation CH deformation 2 NH deformation CH3 wag 2 Fingerprint region
zp
absorbances at 3000-2800, 1460, 1377 and 123 cm were du to mineral oil. The absorbance at 3500-3400 cm-F was due to water from the KBr in the pellet. A diagnostic test for the presence of the adamantane skeleton is the l.ow-intensity absorption in the region 1017-1038 cm-l. The far-in rared spectrum was determined from 6501 - to 100 cm The torsional vibration at 230 cm , which was identical in both the solid and in cyclohexane solution, was assigned (73) to the amino group. A barrier height of 2.00 kcal/molel was calculated. The +band at approximately 490 cm- was torsional vibration. assigned to a NH 3 2.5 Electron Tunnelling and Photoelectron Spectrometry
-5 .
.
Inelastic electron tunnelling spectroscopy is a non-optical vibrational spectroscopy used to study the adsorption of adsorbates on barrier oxide films grown on metals. The interpretation of the spectrum (74) assigns peaks to C-C, -CH2, -CH and C-C-C to be caused by scissoring, bending, twisting, wagging and rocking. Vibrations associated with the amine substituent are almost completely absent, probably due t o interaction with the adsorbing oxide surface. Photoelectron spectroscopy is used to determine ionization potentials, which can test the theoretical procedures used to predict orbital energies. The
12
JOEL KIRSCHBAUM
F i g u r e 3 . I n f r a r e d s p e c t r a of Amantadine h y d r o c h l o r i d e . Upper p o r t i o n ; m i n e r a l o i l m u l l : Lower p o r t i o n , potassium bromide p e l l e t , See t e x t f o r d e t a i l s .
li-
I
13
AMANTADINE
ionization potentials, 11, for a series of adamantane derivatives are similar (75), 9.22 to 9.25 eV, indicating that substituents have little effect. 2.6
Thermal Analysis
Thermal gravimetric analysis (76) of a commercial preparation of amantadine hydrochloride, using a heating rate of 20°/min., showed no loss in weight until 190°, indicating a lack of volatile solvents. Sublimation occurred at about 190" since the inside of the apparatus was covered with powder, These results are in good agreement with a melting range (19) of 180-192'. Differential thermal analysis and differential scanning calorimetry (76) gave a series of endotherms which may be due to sublimation. The parent compound, adamantane, also sublimes. This unusual (21) property for a hydrocarbon is considered due to a face-centered cubic lattice with only forces between the four molec 15s in a unit cell being Y effective (space group TdF43m, a = 9.426 2 0.008A). 2.7
Microscopy
A commercial preparation of amantadine hydrochloride was found to contain irregularly shaped crystals ranging from approximately 18 x 25 pm to There was no visual evidence for 35 x 50 pm (76). polymorphism. 2.8
Surface Area
As measured by nitrogen gas adsorption (76), the surface ar a of one lot of amantadine hydrochloride 9 was 0.73 m Ig. 2.9
Hydration
The crystals are not solvated with water, based on the thermal gravimetric and differential thermal analyses previously described, and the elemental analysis (cf. section 5.1). 2.10 Polymorphism There is weak evidence for polymorphism based on infrared spectrometry (section 3.3) but none by microscopy.
JOEL KIRSCHBAUM
14
3.
Spectrometry of Amantadine in Solution 3.1
Nuclear Magnetic Resonance Spectrometry (NMR) 3.11
1 H-NMR
Figure 4 is the 100 MHz proton NMR spectrum of amantadine hydrochloride in deuterochloroform, as obtained on a Varian XL-100-15 spectrometer equipped to perform Fourier transform spectrometry. Proton chemical to internal shifts were referenced tetramethylsilane (TMS) at 0 ppm. The high degree of symmetry resulted in the simple spectrum which was interpreted as follows: (77)
Chemica1 Shift (ppm)
Relative Area
1.35 1.55
2H 6H
Assignment -NH 8-Ci 6-CH y-CH
6H 3H
1.62
2.05
Chemical shifts of 1-substituted adamantane (78) show large variations due to both the substituent ( 7 9 ) and the solvent. 3.12 13C-NMR The exceptional structure of amantadine has prompted many carbpj~l-13 NMR structural studies. C-NMR spectrum of a commercial Figure 5 shows the preparation of amantadine hydrochloride in deuterochloroform run at 15 MHz on a Jeol FX 60Q NMR system ( 7 7 ) . The natural abundance carbon shifts were referenced to the center line of the CDCl multiplet at 77.0 ppm fion tetramethylsilane, an3 interpreted as follows. The results are in excellent agreement with values reported previously (80). Chemical Shift (ppm) 29.7
36.2 46.2 47.2
Assignment 6-C B -C Y-C a-C
In addition, the calculated shift values agree
Figure 4 :
Proton Magnetic Resonance Spectrum of Amantadine Hydrochloride in Deuterochloroform, as Recorded at 100 MHz.
JOEL KIRSCHBAUM
16
with the experimental results, showing that no large steric interactions ,ayd strain exist between the carbon atoms (81). C Chemical shifts induced by protonation of the amine showed the effects of charge to be transmitted along the carbon skeleton (82) and involve the next-nearest neighbor (6-ef fect) (83). Substituent effects three bonds away (y-effect) have also been studied (84). Comparisons have been made of shifts in 1- and 2-substituted adamantanes (85) , and relaxation times (86). Relaxation times are summarized in section 4.4, Hydrodynamic properties, lanthanide and other shift reagents were used to study the structure (87, 88), donor strength (89), and 8- and y-effects (90). 3.13 15N-NMR The natural abundance 15N nuclear magnetic resonance shift was measured (91) for amantadine P3drochlorideY and found to be 317.1 ppm relative to N-nitric acid. In methanol, the shift of the free base was 317.5, and in benzene the shift was 316.3. The three y carbons of 1-aminoadamantane (see the NMR section for designations of the various carbons in the skeleton) appear to have no influence on the shifts of the free amine or of the hydrochloride. 3.2
Ultraviolet Spectrometry
Below is the ultraviolet spectrum of a commercial preparation of amantadine hydrochloride at a concentration of 100 mg/mL method, obtained with the aid of a Perkin-Elmer Model 320 Spectrophotometer (92). At 226 nm, the molar absorptivity, E , was 0.128; at 222 nm, E was 0.351, and at 205 nv, E was 0.835. Using traditional nomenclature, the Eli values are 0.0068, 0.0187 and 0.044, respective'fy.
4.
Bulk Solution Properties
4.1 Solubilities in Aqueous and Nonaqueous Solvents. Solubilities of a commercial preparation of amantadine hydrochloride were determined (93) at room temperature in various solvents with about one minute of mixing.
Figure 5 :
13C-Magnetic Resonance Spectrum of Amantadine Hydrochloride in Deuterochloroform, as Recorded at 15 MHz.
JOEL KIRSCHBAUM
18
So lvent
Solubility (mg/mL)
Acetonitrile 4 Chloroform 75 Ethano1 200 Hexanes 250 Water >250 Hydrochloric acid solution 0.1M 350 Aqueous buffer, pH 2 75 Aqueous buffer, pH 4 50 Aqueous buffer, pH 7 -2 Aqueous buffer, pH 10 15 >14 >20 >14
2.13 Dissociation Constant The following pKa values have been reported (1): pKBH+ = 8.31 (potentiometric titration) pKBH;+ 3+
=
1.6 (absorption spectrophotometry)
=
- 5 . 3 (absorption spectrophotometry)
psH;+ 2+
+
BH3 , BH2 and BH are respectively triply protonated, doubly protonated and mono protonated species.
DIBUCAINE AND DIBUCAINE HYDROCHLORIDE
121
I
I
I
I
5
15
25
35
Degrees Two Theta
F i g u r e 1 2 . X-Ray Powder D i f f r a c t i o n P a t t e r n of Dibucaine
122
GANDHARVA R. PADMANABHAN
3*
Synthesis Dibucaine and dibucaine hydrochloride are prepared by the following sequence of reactions (Figure 14) starting with isatin (3). Isatin (I) is reacted with malonic acid in the presence of an acid to form carbostyrilic acid (11). The acid is then treated with phosphorous oxychloride to yield 2-chlorocinchoninic acid chloride (111) in solution. The solution is then reacted with diethylaminoethylamine to form 2-chloroN(2-diethylaminoethyl) cinchoninamide (IV) in solution. The cinchoninamide solution is then treated with sodium n-butylate to form dibucaine base(V). The base is purified and then converted to the hydrochloride salt (VI) by reacting with hydrogen chloride.
4.
Stability-Degradation Dibucaine hydrochloride (I) (Figure 1 5 ) , when boiled for 4 hours in 2N hydrochloric acid, resulted in complete hydrolysis to 2-hydroxyquinoline-4-carboxylic acid diethylaminoethylamide (11) and 2-hydroxyquinoline-4-carboxylic acid (III)(4). Hydrolysis of dibucaine hydrochloride, with pH = 5.45 and at a temperature of 134°C for 40 hours resulted in the formation of Compound I1 only Autoclaving of a solution of dibucaine hydrochloride in a mixture of 10% sodium hydroxide and ethanol at 120°C for 2 hours resulted in the formation of 2-butoxyquinoline-4-carboxylic acid (IV). Under the influence of an oxidizing agent such as m-chloroperbenzoic acid, dibucaine can be oxidized to its N-oxide analog (V). The N-oxide can further react with reagents such as ferrous sulfate to yield the desethyl analog (VI) of dibucaine and dibucaine (5).
5.
Drug Metabolism and Pharmacokinetics An apparent half-life of approximately 11 hours with a peak serum concentration at 2 hours after administration was obtained following the administration of single 5 mg dibucaine hydrochloride oral dose (15) to human volunteers. Serum levels of dibucaine in monkeys and dogs after intravenous administration indicated an apparent elimination half-life of approximately one hour. Serum peak concentrations of dibucaine were found after 1-6 hours in monkeys, dogs and humans after rectal administration of an ointment formulation. Rectal administration of the ointment formulation to human volunteers at 0.2-0.6 mg/kg level, t.i.d. for 3 days resulted in peak serum level after the third or fourth dose and declined to base-line within 48 hours
DIBUCAINE AND DIBUCAINE HYDROCHLORIDE
I
5
123
I
2;
1;
35
Degrees Two Theta
Figure 1 3 . X-Ray Powder D i f f r a c t i o n P a t t e r n of Dibucaine Hydrochloride COOH
IV NaOCgHg
111
GANDHARVA R. PADMANABHAN
124
\
0 II
IV
VI Figure 15 Chemistry of Dibucaine and Dibucaine Hydrochloride
0
t
DIBUCAINE AND DIBUCAINE HYDROCHLORIDE
125
of t h e l a s t dose. D i s p o s i t i o n of d i b u c a i n e f o l l o w i n g m u l t i p l e r e c t a l a d m i n i s t r a t i o n of 0.1% s u p p o s i t o r i e s i s comparable t o ointment a d m i n i s t e r e d s i m i l a r l y (6-7). 6.
Toxicity The a c u t e i n t r a p e r i t o n e a l LD50 v a l u e s of d i b u c a i n e h y d r o c h l o r i d e i n male mice and female mice observed over a p e r i o d of 15 days were found t o b e r e s p e c t i v e l y 7 1 mg/kg and 74 mg/kg. The a c u t e o r a l LD50 v a l u e s of d i b u c a i n e h y d r o c h l o r i d e i n m a l e rats and female r a t s observed o v e r a p e r i o d of 1 5 days w e r e found t o be r e s p e c t i v e l y 371 mgfkg and 395 mg/kg (8).
7.
Methods of A n a l y s i s 7.1 I d e n t i f i c a t i o n Two i d e n t i f i c a t i o n tests are g i v e n i n t h e USP XX f o r d i b u c a i n e , one a n i n f r a r e d a b s o r p t i o n t e s t and t h e o t h e r a n u l t r a v i o l e t a b s o r p t i o n t e s t . For d i b u c a i n e h y d r o c h l o r i d e , f o u r i d e n t i f i c a t i o n tests are g i v e n i n USP XX. The t e s t s i n c l u d e d are i n f r a r e d a b s o r p t i o n , u l t r a v i o l e t a b s o r p t i o n , m e l t i n g p o i n t of i s o l a t e d f r e e b a s e and a t e s t f o r c h l o r i d e . Methods t o i d e n t i f y and d i f f e r e n t i a t e d i b u c a i n e from n i n e o t h e r l o c a l a n e s t h e t i c s have been r e p o r t e d i n t h e l i t e r a t u r e ( 9 ) . The methods are based o r t h e m e l t i n g , i n f r a r e d and photomicrog r a p h i c p r o p e r t i e s of t h e d e r i v a t i v e s o b t a i n e d with styphnic acid, p i c r i c acid, c h l o r o p l a t i n i c a c i d , p i c r o l o n i c a c i d , ammonium r e i n e c k a t e and methyl i o d i d e .
7.2
Elemental A n a l y s i s The f o l l o w i n g e l e m e n t a l compositions were o b t a i n e d f o r d i b u c a i n e and d i b u c a i n e h y d r o c h l o r i d e when 2 mg samples were employed f o r a n a l y s i s w i t h a Perkin-Elmer Model 240 CHN Analyzer. DIBUCAINE
Element
Theory, %
Carbon Hydrogen Nitrogen
69.94 8.51 12.23
Found, % 69.67 8.60 12.07
GANDHARVA R. PADMANABHAN
126
DIBUCAINE HYDROCHLORIDE Element
Theory, %
Found, %
Carbon Hydrogen Nitrogen
63.22 7.96 11.06
62.99 8.19 10.88
7.3
Nonaqueous Titration Dibucaine may be titrated in glacial acetic acid with perchloric acid in glacial acetic acid as titrant. The titration can be carried out potentiometrically or with crystal violet as indicator. Dibucaine hydrochloride may be titrated similarly in glacial acetic acid containing mercuric acetate with perchloric acid in glacial acetic acid as titrant. Two equivalents of acid are consumed in the titration of dibucaine and dibucaine hydrochloride. The titration is not specific for the drug in presence of some of their degradation compounds.
7.4
Phase Solubility Analysis Phase solubility analysis of dibucaine hydrochloride has been carried out using the following system (10): Dibucaine Hydrochloride Solvent
Temperature
Ethyl acetate 7.5
25
Approx. Solubility mdg 15.4
Thin-layer Chromatography A number of thin-layer chromatographic systems have been developed for the identification of the drug and for the determination of the compounds related to the drug. System I
-
Adsorbent :
The following system may be employed particularly to control the impurities likely to be present from the synthesis of the drug.
Silica Gel G plate, 20 cm x 20 cm coated to a thickness of 250 microns Mobile Phase: A mixture containing 30 mL of acetone, 50 mL of toluene, 5 m L of methanol and 1 m L of concentrated ammonium hydroxide.
DIBUCAINE AND DIBUCAINE HYDROCHLORIDE
127
System I Continued Detection Systems:
1. Spray with 0.5% potassium dichromate in 20% sulfuric acid followed by heating at 140°C for 10 minutes and viewing under shortwave UV 2. Irradiate with high intensity UV for 10 minutes followed by visualization under long wave UV
System I1 - The following system may be employed particularly when 3-chloro dibucaine content in the drug has to be determined. Silica G plate, 20 cm x 20 cm, coated to a thickness of 250 microns Mobile Phase: A mixture of 35 mL of glacial acetic acid, 55 mL of ethyl acetate, 5 mL of concentrated hydrochloric acid and 5 mL of water Detection Systems : 1. Shortwave UV 2. Irradiation with high intensity UV for 10 minutes followed by visualization under longwave UV Adsorbent:
System I11
-
The following system may be employed for the estimation of transformation products in formulations
Silica Gel G plate coated to a thickness of 250 microns Mobile Phase : A mixture of 80 mL of chloroform, 20 mL of methanol, 1 mL of ammonium hydroxide and 1 mL of water Detection System : Irradiate with high intensity W for 10 minutes followed by visualization under long-wave Adsorbent:
w
GANDHARVA R. PADMANABHAN
128
Other Systems: The following systems have also been employed for the analysis of dibucaine or dibucaine hydrochloride. System IV -
System V
Chloroform/Acetone/Diethylamine
-
System VI
System VII
-
. System VIII System IX
System X
-
-
-
System XI
-
System XI1 -
System XI11
(5:4:1); Silica Gel GF; Dragendorff Spray, Iodoplatinic Acid Spray and UV Detection Systems (11) Chloroform/Diethylamine ( 9 : l ) ; Silica Gel GF; Detection Systems same as in System IV Methanol/Ammonium Xydroxide (100: 1.5); Silica Gel GF; Detection Systems same as in System IV n-Butanol/Acetic Acid/Water (5:3:2); Silica Gel GF; Detection Systems same as in System IV Chloroform/Methanol (9:l); Silica Gel GF; Detection systems same as in System IV Dioxane/Water ( 9 : l ) ; Silica Gel GF; Shortwave W,Longwave UV, 0.5% Iodine in Chloroform Spray, Acidified Potassium Iodoplatinate Spray and 40% Sulfuric Acid Spray Followed by Heating and Longwave UV Detection Systems (11) Dioxane/Water/Chloroform (8:l: 1); Silica Gel GF; Detection Systems same as in System IX Dioxane/Water/Toluene (8:l:1); Silica Gel GF; Detection Systems same as in System IX Acetone/Benzene/Methanol/Concentra-
-
ted Ammonium Hydroxide (30:50:5:1); Silica Gel G; Longwave UV After 10 minute Irradiation with High Intensity W Chloroform/Methanol/Water (80:20:2); Silica Gel G; Dichromate in 20% Sulfuric Acid spray followed by heating and visualization under short-wave UV
129
DIBUCAINE AND DIBUCAINE HYDROCHLORIDE
7.6 High Performance Thin-layer Chromatography The following system has been reported for the quantitation of dibucaine in injectable solutions and in plasma and serum samples (12). Developing Solvent: Adsorbent: Chamber Saturation: Development Distance: Time of Development: Sample Volume Detection Mode:
7.7
Ether/Benzene/Cyclohexane/Diethylamine (20:12.5:10:3.5) HPTLC Silica Gel 6 0 F254 (Merck) 15 minutes 4 cm 5 minutes 200 nL Reflectance (240 nm)
High Pressure Liquid Chromatography The following systems have been reported for the quantitation of impurities in dibucaine and dibucaine hydrochloride samples (13). System I Column :
25 cm x 4.6 mm i.d. Zorbax C-8 stainless steel column with 6.5 cm x 2.1 mm i.d. Whatman CO-Pel1 ODS guard column Detection: W-313 nm Temperature: Ambient Flow Rate: 1 mL/minute Mobile Phase: Linear gradient from 100% A to 95% B in 20 minutes. A = 1:l methanol-water; B=0.2% ammonium hydroxide in 2:8 methanol-acetonitrile System 11 (11) 25 cm x 4.6 mm Lichrosorb RP 8 column Detection: UV 254 nm 25 C Temperature: Flow Rate: 2 mIJminute Mobile Phase: A. Methanol-Water-Diethylamine (90:10:0.02) B. Methanol-Water-Diethylamine (80:20:0.02) C. Methanol-Water-Diethylamine (75: 25:0.02) Column :
GANDHARVA R. PADMANABHAN
130
System I1 Continued Approximate Retention Time of Dibucaine
A = 4.5 minutes B = 7.4 minutes C = 10.9 minutes
System I11 (14) Column:
50 cm x 2.1 mm (i.d.) stainless steel column packed with Permaphase ODS Detection: W-254 nm Fluorescence: Excitation-325 nm and Emission-390 nm 40O C Temperature: Flow Rate: 0.85 mL/minute Mobile Phase: 50% Isopropanol, 45% Methanol and 5% 0.001N NaOH 7.8 Gas Chromatography The following system has been employed for the analysis of dibucaine in the drug substance and in a suppository formulation. Column: Temperature: Detector: Carrier: Sample: 7.9
4 mm (i.d.) column with 3% OV-17 on Gas Chrom Q (100 x 120 mesh) Column 25OoC; Injector - 27OOC; Detector - 300°C Flame Ionization Detector Helium 60 cc/minute Inject 2.0 pL of a 10 mg sample in 1 mL of tetrahydrofuran 6 ft x
-
Gas Chromatography-Mass Spectrometry (GC-MS) Sensitive methods €or the analysis of dibucaine in serum samples have been reported using GC-MS with selected ion-monitoring for separation and detection. The following experimental conditions were used for the analysis of the drug in biological fluids. Method I (15) Column : Detection:
2.5 ft x 2 mm i . d . silanized glass column packed with 1.5% OV-17 on 80/100 mesh Chemosorb W-HP GC-MS selected ion monitoring at m/e = 228 and at m/e = 237
131
DIBUCAINE AND DIBUCAINE HYDROCHLORIDE
Method I Continued Temperature:
Carrier: MS E I Source: Internal Standard:
I n j e c t o r - 260°C; Column GC-MS I n t e r f a c e -250°C Helium 37 ev
-
250°C:
Nonadeuterated d i b u c a i n e
Method I1 (15) Column : Detection: Temperature:
Carrier: MS C I Source: C I Reagent Gas: Internal Standard :
2.5 f t x 2 mm i . d . s i l a n i z e d g l a s s column w i t h 1 . 5 % OV-1 on Chromasorb W-HP 80/100 mesh GC-MS (CI) s e l e c t e d i o n m o n i t o r i n g a t m / e = 344 and m / e = 353 Column - 215°C; I n j e c t o r - 260°C; GC-MS I n t e r f a c e - 250°C Methane 55-85 ev Methane Nonadeuterated d i b u c a i n e
Method I11 (16) Column: Detection: Temperature: Carrier: In t e r n a 1 Standard :
0.5 m x 3 mm i . d . g l a s s column packed w i t h 3%Poly 1-110 on Gas Chrom Q 80-100 mesh E . I . S e l e c t e d ion-monitoring a t m/ e=86 Column - 260°C; I n j e c t o r - 350°C; S e p a r a t o r - 3OO0C, I o n Source 310 C Helium, 30 mL/min Chloropromazine H C 1 (m/e=86)
Method I V (17) Column : Detection :
2 m x 2 mm g l a s s column packed w i t h 3% OV-17 on 80-100 mesh GasChrorn Q GC-MS s e l e c t e d i o n monitoring a t m / e = 326 and a t m / e = 335 and 336
GANDHARVA R. PADMANABHAN
132
Method IV Continued Temperature:
Column: Programmed at G°C/minute from 260-300°C; Injector - 300°C; Ion Source - 300°C Carrier: Not indicated; 30 mL/minute MS-EI Source: 75 ev; ionizing current - 300 PA Internal Deuterium-labeled dibucaine (Dg Standard : and Dlo) 7.10 Paper Chromatography Stationary Phase: Whatman #1 paper impregnated with a 1:l solution of acetone and formamide Formamide was adjusted to pH 5.6 with benzoic acid before mixing. Remove the excess of the impregnated solution by blotting between dry filter papers Mobile Phase: 2% pyridine in 1:l benzenechloroform Detection: Dragendorff spray reagent Sample Spot 10 pL of 1% dibucaine Solution: hydrochloride in 1:l methanolchloroform (18) R of f Dibucaine HC1: -0.75
.
7.11 Polarography Polarography has been employed for the analysis of dibucaine in soLutions and for the identification of dibucaine (19-20). Polarography was carried out using a borate-biphosphate buffer with pH of 5 to 7.5 and measuring the reduction current at -0.6 V vs calomel electrode. The method was linear between 5 and 150 mg/100 mL. 7.12 Spectrophotometry Dibucaine and dibucaine hydrochloride in formulations can be analyzed by spectrophotometry (21) by taking advantage of the maxima at 247 nm and 320 nm in acidic solutions. The technique when preceded by acid-ether and base-ether extraction steps is selective for all products discussed under Section 4 , Stability-Degradation, except for compound VI.
DIBUCAINE AND DIBUCAINE HYDROCHLORIDE
133
8.
Miscellaneous 8.1 Dibucaine Number When succinylcholine, which is a neuromuscular agent, was introduced for anesthetic procedures, it was observed that certain individuals failed to recover from the paralytic effects and this poor recovery was attributed to the low activity of the enzyme cholinesterase in plasma. The identification of the atypical enzyme activity has been carried out by the selective inhibition of the plasma esterase by dibucaine with benzoylcholine as substrate. A quantitative measure of this selective inhibition, expressed as a percent of inhibition, is called the dibucaine number (22-25).
9.
References
1. Martucci, J . D. and Schulman, S. G., Anal. Chim. Acta, 77, 317 (1975) 2. Hrdy, 0. and Slouf, A., Cs. Pharm., 1,7 1 ( 1 9 5 2 ) ; and Die Pharmaczie, 8, 1 5 9 ( 1 9 5 3 ) 3. CIBA-GEIGY, Personal Communication 4 . Morch, J . , Dansk. Tidsskr. Farm., 27, 1 7 5 (1953) 5. Senn, H. and Kathriner, A., CIBA-GEIGY, Personal Communication 6 . Alkalay, D., Carlsen, S., Khemani, L., Wagner Jr., W. E . , and Le Sher, A., CIBA-GEIGY, Personal Communication 7. Bartlett, M. F. and Egger, H., CIBA-GEIGY, Personal Communication 8. Thomann, P. and Pericin, C., CIBA-GEIGY, Personal Communication 9 . Rich, N. W. and Chatten, L. G., J . Pharm. Sci.,
5 4 , 9 9 5 (1965) 10. Grady, L. T., Pharmacopeial Formum, United States Pharmacopeial Convention, Inc., p. 1 4 3 6 , Sept.Oct. 1 9 8 1 11 Grady, L. T., USP-NF Reference Standards Committee, United States Pharmacopeia, Letter 9 9 , p. 432438, dated February 2 5 , 1 9 8 1 1 2 . Giibitz, G. and Wintersteiger, R., Sci. Pharm., 4 6 , 275 (1978) (German) 13. Liu, R., CIBA-GEIGY, Personal Communication 1 4 . Takeoka, T., Kojima, T. and Kobayashi, H., Nippon 20 (1979) (Japan) Hoigaku Zasshi, 15. Alkalay, D., Carlsen, S. and Wagner, W. E., Anal. Letters, 14(B20), 1 7 4 5 (1981) 1 6 . Kageura, M., Totoki, K. and Nagata, T., Nippon Hoigaku Zasshi, 2, 188 ( 1 9 7 8 ) (Jap. J . Legal Med.) (English)
s,
134
GANDHARVA R. PADMANABHAN
17. 18. 19. 20.
Shinka, T., Kuhara, T. and Matsumoto, T., Quant Mass Spectrom. Life Sci., 2, 315 (1978) Korzun, B. P., CIBA-GEIGY, Personal Communication Dusinsky, G., Pharmazie, 9, 27 (1954) Pech, J., Collection Czechosl. Chem. Communications, 6,
132 (1934)
21.
United States Pharmacoepia, Twentieth Revision, Mack Printing Company, Easton, PA, 1980, pages
22.
Kalow, W. and Genest, K., Canad. J . Biochem. Physiol., 35, 339 (1957) Harris, H. and Whittaker, M., Nature, 191,496
226-228
23.
(1961) 24. 25.
Brody, I. A., Resnick, J. S. and Engel, W. K., Arch. Neurol., 13,126 (1965) Irwin, R. L. and Hein, M. M., Biochem. Pharmacol.,
15,
145 (1966)
10. Acknowledgement
The author expresses appreciation to Ingrid Becue, Richard Brown, James B. Smith and Jane Johnson f o r help in preparation of this manuscript.
ESTRONE Douglas Both I . Introduction 1.1 History 1.2 Structure, Nomenclature, and Molecular Weight 1.3 Biosynthesis and Metabolism 1.4 Synthesis and Commercial Production 2. Physical Properties 2.1 Crystal Structure 2.2 Powder X-Ray Diffraction 2.3 Melting Point 2.4 Thermal Analysis 2.5 Magnetic Susceptibility 3. Spectrometry 3.1 Proton Nuclear Magnetic Resonance 3.2 Carbon-I3 NMR Spectra 3.3 Mass Spectrometry 3.4 Infrared Spectrometry 3.5 Ultraviolet and Visible Spectrophotometry 3.6 Optical Rotatory Dispersion and Specific Rotation 3.7 Fluorescence and Phosphorescence 4. Solution Properties 4.1 Solubility 4.2 Partition Coefficients 4.3 Molecular Volume 4.4 Heat of Formation and Combustion 4.5 Acid Ionization Constant 4.6 Stability 5. Chromatographic and Other Separation-based Analysis 5.1 Column Chromatography 5.2 Thin Layer Chromatography 5.3 High-Performance Liquid Chromatography 5.4 Gas-Liquid Chromatography 5.5 Gas Chromatography-Mass Spectrometry 6. Radioassay 7. Colorimetric Analysis 8. Titrimetric Analysis References
ANALYTICAL PROFILES OF DRUG SUBSTANCES VOLUME 12
135
136 136 137 137 142 144 144 145 145 145 149 149 149 149 152 154 156 156 157 158 158 158 158 160 160 160 161 161 163 165 167 169 170 172 174 174
Copyrightby the American Pharmaceutical Association. ISBN 0-12-260812-7
DOUGLAS BOTH
136
1.0
INTRODUCTION
1.1
HISTORY
In 1 8 9 6 l Y 2 , Dr. Emil Knauer, using ovarian transplants into immature female animals, first demonstrated the existence of sex hormones. In 1909, Henry H. Dale developed a posterior pituitary gland extract which stimulated uterine contraction that found great use during complicated labor. This was the beginning of the steroid era. In 19273, two Berlin gynecologists, Dr. Selmar Aschheim and Dr. Bernard Zondek, while developing a method for the early diagnosis of pregnancy, established that the urine of pregnant women contained a high concentration of estrogen. Before this discovery, the isolation of estrogens had been unsuccessfully pursued from placental extracts. Dr. E.A. Doisy and Dr. E. Allen, were working towards the isolation, purification and crystallization of estrone from pregnancy urine. Aldolf Butenandt, under the direction of nobel prize winner Adolf Windaus of Gijttingen University, was also independently working towards this goal. After nearly two years, in August of 1929, Doisy4 and Allen reported the first account of the purification and crystallization. A few months later in Octob%r 192g5, Butenandt also reported its isolation. Butenandt claimed that Doisy and Allen preempted him by virtue of an annual cleaning of the Gijttingen Laboratory. The laboratory was shut down for several weeks, just as he had obtained a potent extract and was 10-14 days from purification. At7 first, only the physiological effects and some chemical properties were known. The first physico-chemical characterization of the crystal and the correct empirical formula were reported by Thayer in 1930. The name estrone was not adopted until 1935. The first partial of estrone was performed by Inhoffen in 1 9 4 1 and the first total synthesis in 1948 by Anner. The isolation of estrone was of great importance, for it was the first estrogenic steroid hormone isolated. The great interest generated by this compound was responsible for the isolation of later steroid hormones. It was these later steroids that revolutionized the treatment of many different illnesses,
ESTRONE
1.2
137
STRUCTURE, NOMENCLATURE AND MOLECULAR WEIGHT
The basic skeletal structure of estrone is the cyclopentanoperhydrophenanthrene nucleus. This nucleus is composed of the four rings designated A,B,C and D. Each carbon atom of the ring is numbered in rotation. The methyl group is found in the beta position in naturally occuring estrone. See figures 1 and 2. Estrone is a white crystalline powder or a colorless flat plate-like crystal. The powder is virtually odorless. The name estrone is the offically adopted name, other common synonymous names include: Oestrone, 3-hydroxyestra-1,3,5(10) trien-17-one, folliculin, ketohydroxyestrin, menformon, theelin and follicular hormone. The empirical formula is C H weight of 270.37. Estrone is gl!en2$he systematic number [53-16-71,
O2 with a molecular chemical abstracts
1.3 BIOSYNTHESIS AND METABOLISM Estrone is resent in plants and animals. It has been found in plantslg-14 such as the date, apple, pomegranate, oat, apricot and in the oils of corn and olive. In the major source is the ovary and to a lesser extent, the adrenal cortex, feto-placental unit and Leydig cells of the testis.
-In Vitro s t u d i e ~ l ~ have ’ ~ ~shown that estrone arises from acetate. After several Nicotinamide-Adenine Dinucleotide Phosphate (NADPH) dependent condensation reactions, acetate forms squalene, which subsequently undergoes elimination and cyclization to yield cholesterol. Cleavage of the side chain of cholesterol and several rearrangements yield pregnenolone. Oxidation and isomerization produce progesterone which leads to 4-androstene-3, 17-dione and finally to estrone. An overview of the pathway can be seen in figure 3 . Questionsz0 have been raised as to whether cholesterol is a required intermediate in the synthesis. It seems that several experiments have shown that the precursers of cholesterol are incorporated into certain cells much more readily. B. R. Bhavnani2 discusses other nonclassical approaches to the biosynthesis of steroids which bypass cholesterol as an intermediate.
DOUGLAS BOTH
138
ESTRONE F i g u r e 1. The S t r u c t u r e of E s t r o n e
F i g u r e 2. Conformation Diagram o f E s t r o n e . (Redrawn from R e f e r e n c e 82.)
ESTRONE
Figure 3 . Summary of the biosynthesis of estrone and other steroids. (Adapted from references 18, 19.)
139
140
DOUGLAS BOTH
During the synthesis and metabolism, addition or removal of hydrogen is catalyzed by enzymes found in the ovary. Addition of oxygen is catalyzed by hydroxylases, usually taking place in the liver and kidney, which are important sites for the inactivation of steroids. Hydroxylation reactions usually occur at the 2, 6 , 8 , 11, 16 or 18 carbon positions, and require molecular oxygen while utilizing NADPH. Omura22 worked out the electron transport system for the 11-8 hydroxylation which occurs in the adrenal mitochondria. Hydroxylation involves the transport of hydrogen from NADPH to flavoprotein. The reduced flavoprotein transfers electrons to a non-haem protein. The reduced non-haem protein will transfer electrons to cytochrome P-450. It is believed that this type of pigment system exists for other biosynthesizing tissue such as the feto-placental unit. Estrone exists in bound and unbound forms. It is this binding with protein that plays a role in the metabolism of estrone. E ~ t r o n e binds ~ ~ ’ ~strongly ~ to red blood cells which may increase its solubility, and thus, function to regulate its distribution and availability to target organs. ConjugationZ5 of estrone in the liver works to inactivate the steroid while secretion of a sulfate conjugate by the adrenal cortex serves as a reservoir for later activation in target organs. Hydroxylation26 and methylation appear to be major modes of estrone metabolism. Both metabolites, as well as estrone, in the form of glucuronic acid or sulphate conjugates, appear in significant quantities in urine. Estrone can be readily converted into a number of products as shown in figure 4. During the metabolismz7 of estrone, a rapid equilibrium is established between estrone, estriol and 178-estradiol. This equilibrium has been studied in vitro in the liver and kidney by Rayan28 and Velle29. The equilibrium ratios of estrone, estriol and 17B-estradiol in urine are approximately 45:45:10. The rate constant for the conversion of estrone to 176-estradiol in the uterus, however, is 10-20 times larger than the rate constant for the reverse reaction. MuseyZ6 discusses the pathways for the metabolism of estrone sulfate and other conjugates in greater depth; also discussed are conjugate transport dynamics and hydrolysis.
ESTR 0NE
141
'2. HVOROXVESTRONE
-
Flgure 4 Summery of the metabollrm of emone. (Adapted from reference 18, 10.)
'2. YETHOXVESTRONE
142
DOUGLAS BOTH
Plasma 30’35 levels of estrone for men range form 0.1-0.42 ug/L. For women, levels range from 0.2-0.7 pg/L, depending on the phase of the menstrual cycle. Urinary excretion levels for men are 3-8.2 pg/24 hr, and for women are 0.3-2.4 pg/24 hr.
1.4 SYNTHESIS AND COMMERCIAL PRODUCTION The first partial synthesis36 of estrone was accomplished by Inhoffen in 1941. The first total synthesis was reported by Anner37 and Miescher in 1948. Since that time, a multitude of starting products, intermediates and routes have been reported. Estrone is an important synthetic product, for it is a key intermediate in the synthesis of many complex 19-nor steroids. As early as 192838, Parke-Davis and Co. produced an ovarian extract of estrone. Following the early crude products were purer forms extracted from urine, as reported by Schering-Kahlbaum and later Roussel and N.V. Organon. After the discovery of the levels of estrone in the urine of stallions and pregnant mares, Zondek, and later American firms, produced estrone extracted from urine. While the extraction process initially proved economically feasible, improved partial or total synthesis became more cost effective. The in production of synthetic estrone was Roussel who converted dehydroisoandrosterone to estrone. Dehydroisoandrosterone can be produced from cholesterol which, in turn, can be extracted from plant and animal oils, grease, wool and waxes. Other methods of production included: pyrolysis, microbiological reduction or transformation. For a review of fermentation in industrial applications see Reference 41, there are several papers that review the general synthesis of estrone See References 42-46. Table (1) gives a listing of selected syntheses. Table 1 REFERENCE 47
48
-
Selected Syntheses METHOD Regiospecific fuctionalization of 2,3, BIS(trimethylsily1)estratrien -17-one using cobalt catalyst Regiospecific Diels-Alder using, 6methoxy-l-vinyl-3,4-dihydronapthalene
ESTRONE
143
49
Biomimetric polyene cyclization
50
From ethyl-l-carbethoxy-2-oxo-lcyclohexaneacetate
51
From methyl-l-keto-2-methyl-7methoxy-1,2,3,4,4A,9,10A-octahydro-2-phenanthrenecarboxylate
52
From 1,4-androstandiene-l9-01-3,20dione-19-benzoate
53
From a mixture of androsta-1,4diene-3,17-dione-l7-(cyclic ethylene acetal) and 20-(hydroxymethyl) pregna-lY4-diene3-one.
54
By irradiation of 3,3,17,17-bis
55
From 4-pregnene-17aYl9,21-trio~-3,
56
From androsta-1,4-diene-3,17-dione-17ethylene acetal
57
From 3,17-dioxestra-4,9-diene by isomerizing in the presence of an acylhalide
58
By fermentation using brevibacterium (ATCC 19653)
59
By asymmetric conversion of 2-methyl-2-carbethoxyethyl cyclopentane1 ,3-dione
60
By systematic degradation from
(ethylenedioxy)-19-hydroxy-5-androstene 20-dione-19,21-diacetate
106-hydroxy-19-norperlplogenin
61
From 19-nor-4-androstene-3,17-dione with p-cymene catalyzed by lead on carbon
62
An expeditious synthesis
63
From 5-androstene-3f3,19-diol-l7-one by microbiological action of mycobacterium phlei strain w
DOUGLAS BOTH
144
64
By oxidation of 19-nor-1(10),5-androstadiene 36-01-17-one
65
By steroselective intramolecular cycloadditon of olefinic-o-quinodmethane
66
From andro-1,4-diene-3,17-dione
67
From 17B-estradiol by enzymatic oxidation and reduction using Pseudomonas testosteroni
68
Microbiological transformation with the use of cholest-4-ene-3-one as a steroid inducer
69
By microbiological conversion of 19-hydroxy-androst-4-ene-3,17-dione
70
From m-CH OC H CH CH:CH2 3 6 4 2
71
By cationic olefinic cyclization
72
From 2B-hydroxy-3,17-dioxoandrost4-ene-19-al
73
From 19-hydroxycholesterol acetate by mycobacterium conversion
74
By microbiologica~dehydrogenation of 3-keto-4-steroids
75
From l-hydroxy-4-androstene-3,17-dione by fermentation with Penicillium Sp (ATCC 12,556)
76
From andro-1,4-diene-3,17-dione pyrolyzing with hot kerosine.
2.0
PHYSICAL PROPERTIES
2.1
CRYSTAL STRUCTURE
by pyrolysis
by
Estrone exists in three polymorphic crystalline forms. The polymorphic form obtained depends on the mode of crystallization. Two forms are orthorhombic; Form I is stable and Form I1 is a metastable state. The third form, Form 111, is monoclinic and metastable.
ESTRONE
145
Forms I and I11 are usually obtained by sublimation, while Form I1 can be obtained by evaporation from a solution of acetone or methanol. The crystalline cohesion of the three forms are different. Forms I and 11177 have layers of parallel molecules linked by hydrogen bonds and Form I1 has a herring bone arrangement with weaker hydrogen bonds and stronger dispersion bonds. Figure 5 7 8 is a diagram of the two crystalline forms. Bernard B u ~ e t t a ' ~ - ~ ~ has studied the crystalline form of estrone quite extensively. Table 2 is a summary of the parameters of the three crystalline forms as measured by Busettair7. 2.2
POWDER X-RAY DIFFRACTION
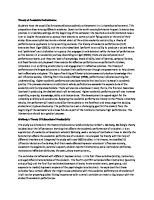
Figure 6 is the x-ray powder diffractionB2 spectrum of the U.S.P reference standard estrone. The spectrum was obtained using a Philips powder diffraction unit utilizing the Ka emission of copper at 1.54A. The sample was scanned "as is" from 8 to 48 degrees ( 2 0 ) . The d spacing in angstroms is given above each major peak in the diffraction spectrum. The d spacings of the major peaks appear to be consistant with published valuesM3. 2.3
MELTING POINT
AtH4 1 8 0 " C , unstable crystals in the shapes of rods and prisms begin to sublime. At 22OoC, stable rectangular shaped crystals sublime. At about 2 3 0 " C , some of Form I11 is converted into form I. The remaining portion of the original substance melts at 254°C (Form 111) or at 256°C (Form 11) while Form I melts at 259°C. 2.4
THERMAL ANALYSIS
Differential thermal a n a l y ~ i s ~of~ 'estrone ~~ shows a small broad endotherm at about 230°C which seems to indicate a crystalline transition described in section 2 . 3 . A sharp strong endotherm at 258°C probably corresponding to the melting process is also seen. The derivatogram shows weight loss of 1 9 . 4 , 2 3 . 8 , 3 4 . 4 and 5 1 . 2 % at 3 5 0 , 3 6 5 , 395 and 4 2 5 " C , respectively. The differential thermal analysis of the U.S.P. reference standard estroneE7, scanned at 2"C/min, shows a sharp endotherm at 264°C and a broad minor endotherm between 2 3 1 and 237°C. The U. S.P. reference standard estrone",
105°C for 3 hours, lost 0.13% of its weight.
dried at
DOUGLAS BOTH
146
a
-
",
ORTHORHOMBIC FORM Figure 5 - The two crystalline forms of estrone. (Redrawn from reference 78.)
TABLE 2
FORM I Mode of Crystallinzation State Crystal form
Sublimation Stable Or thorhombic
PZ1'
Space Group
-
CRYSTAL DATA
FORM I1
FORM I11
Evaporation from Acetone or Methanol Metastable Orthorhombic
zl, 2,
PZ1' Z1'
Sublimation Metastable Monoclinic
z1
p2 1 Two independent
Molecules per unit cell (Z)
4
" 3 Cell volume (A)
4
(4)
molecules
1481
1440
1461
12.188
10.043
9.271
16.301
18.424
22.285
7.463
7.787
7.610
90
90
90
B 5 0.2"
90
90
111.45
0.2"
90
90
90
Cell dimensions: 0
a + 0.005 A 0
b + 0.005 A 0
c + 0.005 A a + 0.2"
y
Fig. 6. Powder X-Ray Diffraction Spectrum of Estrone.
149
ESTRONE
2.5
MAGNETIC SUSCEPTIBILITY
The mean molar magnetic susceptibility88 of estrone re r stallized from methanol was found to be -176.47 x 10⁶ s y cm /mole, when measured according to the Faraday method. Values calculated according to the Pascal empirical systematic, the revised Pascal systematic and the empirical systematic f r bonds were rep0 ted to be -170.74 x 10 , 8 6 3 -180.95 x 10 and -180.10 x 10 cm /mole respectively. 3.0
SPECTROMETRY
3.1
PROTON NUCLEAR MAGNETIC RESONANCE
The proton nuclear magnetic resonance spectrum of the U.S.P. reference standard estrone is shown in figure 7 . The spectrum was obtained on a Varian XL-100 at 100.1 MHZ in deuterochloroform (CDC1 ) using tetramethylsilane (TMS) as a internal reference. 3 Because of the similar magnitude of the coupling constants and chemical shifts of the protons of the aliphatic rings, normal splitting patterns are distorted. Virtual coupling of these protons make spectral assignment difficult. The spectrum shows only one singlet at 0.9 ppm from TMS belonging to the axial methyl protons. 3.2
CARBON-13 NMR SPECTRA
The proton decoupled Carbon-13 nuclear magnetic resonance spectrum89 of the U. S.P. Reference Standard estrone is shown in figure 8. The spectrum was obtained on a Varian XL-100 at 15.4 MHZ. The resonance assignments of the carbons of estrone are shown in Table 3. The resonance chemical shifts of the carbons from TMS are shown to range from 13.3 to 219.4 ppm. The Carbon-13 spectra of estrone and other Eteroid hormones were studied in several recent papersg0 93. The tritium nuclear magnetic resonance spectra of estrone and estrone sulphate have also been studied, yielding information concerning the distribution of tritium between labeled sites on the steroidg4,
L
u 0 ,
Fig. 7.
Proton NMR Spectrum of Estrone:
Instrument: Varian XL-100
L
9
Fig. 8. Carbon-13 NMR Spectrum of Estrone.
Instrument: Varian XL-100
DOUGLAS BOTH
152
TABLE 3 CARBON-13 RESONANCE ASSIGNMENTS CARBON
PPM DOWNFIELD FROM TMS
125.5 112.5 154.7 114.8 136.8 37.9 26.0 28.9 43.3 129.7 25.4 31.1 47.2 49.7 20.9 35.2 219.4 13.3
1 2 3 4 5 6 7 8 9 10 11 12 13
14
15 16 17 18 3.3 MASS SPECTROMETRY
Figure 9 gives the low-resolylion mass spectrum of the The high-resolution U.S.P. reference standard estrone spectrum is given in Table 4. The molecular ion was found at m/z 270.1585 while the anticipated molecular ion is m/z 270.1620. The fragmentation seen in Table 4 appears to be consistant with the structure and mass spectrum of estrone.
.
TABLE 4 HIGH RESOLUTION MASS SPECTRUM
Mass Found
Mass Calc.
Formula
270.1585
270.1626
C18H2202
242.1298
242.1307
16H1802
237.1306
237.1279
C17H170
226.1388
226.1357
16H180
C2H40
213.1232
213.1279
15H17'
C3H50
Compositional Loss
C2H4 CH50(CH3+H20)
UJ
a
ul
(3
3
DOUGLAS BOTH
154
211.1115
211.1123
199.1072
199.1123
185.0943
185.0966
172.0913
172.0888
159.0776
159.0810
146.0702
146.0732
144.0542
144.0524
133.0654
133.0653
131.051 1
131.0497
120.0603
120.0575
107.0537
107.0497
3.4
C15H150
C3H70 (H20+C3H5)
1qH1'5
C4H70
13'1 3'
C5H90
C12H120
C6H100
c1lH1lo
C7H110
CIOHIOo
'gH12'
1OH8O
'gH14'
C9H90
'gH13'
C9H70
'gHISO
'sH8' C7H70
10H14' 'llH15'
INFRARED SPECTROMETRY
The infrared spectrum of the U.S.P. reference standard estrone is shown in figure 10. The spectrumg7 was obtained as a solid sample disc composed of 1 mg of estronel300 mg KBr. Table 5 gives a possible interpretation of the given spectrum. The interpretation appears to be consistent with a previous published paperg8. TABLE 5 IR SPECTRAL INTERPRETATION FREQUENCY (an-')
Assignment
3325
0-H Stretch
3050-3000
C-H Aromatic Stretch
2990-2800
C-H Aliphatic Stretching
1725 1620-1580
C=O Stretch
A dpublet straddling 1600 cm-l and a single peak at 1500 cm indicative of C-C aromatic stretching and endocyclic bonding
Fig. 10.
Infrared Spectrum of Estrone.
DOUGLAS BOTH
156
1475-1350
CH3-C Bending
1285-1250
A dpublet straddling 1275
-
cm OH bonding and C-0 stretching indicative of aromatic OH
C-C Stretching region quite complex, showing large numbers of H-present.
1200-850
3.5
ULTRAVIOLET AND VISIBLE SPECTROPHOTOMETRY
The ultravioletg9 spectrum of estrone 3n p-dioxane shows maxima a about 282 nm ( E = 2.37 x 10 ) and 296 nm (E = 2.13 x 10 ). An ethanolic solution of the U.S.P. reference standard8’ estrone at a concentration of 1 in 25,000 w/v exhibits a maxmium at about 280 nm with a In concentrated sulfuric acid, l o o absorptivity of 2.72. strong absorption occurs at about 300 and 450 nm, and in 0.1g sodium h droxide at about 239 and 293 nm. The far ultravioletluY spectrum of estrone in n-hexane exhibits a strong absorption at about 200 nm, a shoulder at about 225 nm and a broad band at 275 nm.
5
The visible spectrum’O 2 of estrone treated with Engelbrecht-Mori-Anderson cholesterol reagent (E.M.A.) (1.0 g FeCl 6 H 0, 40 mL 85% H PO in 500 ml AcOH, 500 ml H2S04), scannea a$ 2OoC, showed Lxfma at about 392 and 484 nm. 3.6
OPTICAL ROTATORY DISPERSION AND SPECIFIC ROTATION
Several optical rotator dispersion studieslo3’ll4 have been reported. EstroneroS exhibits a maximum absorption at 310 nm with molecular rotations of 157,000 in a solution of methanol. Estrone shows a negative cotton effect at 275 nm and a weak positive cotton effect at 225 nm with a molecular rotation of 33,750. The specific rotation of a 1%solution of the U.S.P. reference standard estrone determined in a solution of dioxane was +163O. Estrone has been determined by differentialspectropolarimetry.l o 6 This method is based on the difference in the optical activity of estrone and sodium borohydride reduced estrone (Estradiol). Estrone can be determined in the range of 30-1200 ug/ml.
ESTRONE
3.7
157
FLUORESCENCE AND PHOSPHORESCENCE
The f l u o r e s c e n ~ eof~ estrone ~ ~ ~ ~ ~in ~ ethanol, when excited at 280 nm, shows a sharp fluorescence emission peak at 307 nm and a second, broad peak at approximately 410 nm with a decay time of 3.8 ns. A broad, emission band at 410 nm is the fluorescence of the carbonyl group, while the phenolic chromophore emission is at the shorter wavelength. Most of the excitation energy that is absorbed is due to the phenolic chromophore. A very efficient energy transfer to the carbonyl group allows for its weak fluorescence. In solid film, estrone exhibits no carbonyl fluorescence. This is believed to be a result of hydrogen bonding between the phenol hydroxyl and the carbonyl group in the crystalline film. The phosphorescence1O9 emission spectrum of estrone consists of a single broad peak at 410 nm. The quantum yield of the phosphorescence is 0.025 with a decay time of 2.5 S. The phosphorescence is due to only the phenolic chromophore. The fluorescence of estrone may be used to detect its presence at higher concentrations. However, the intensity of the fluorescence is not great enough for use in most cases where estrone is in trace amounts. Estrogens can produce fluorophores when placed in solutions of strong acids such as sulfuric and The reaction of estrogens with phosphoric1l0'lZ1. 1-dimethylaminonaphthalene-5-sulfonyl chloride (Dansyl Chloride) usually results in a substitution at the carbon 3-position of most estrogens to yield a fluorescent d e r i v a t i ~ e ' ~ ~ ' ~ This ~ ~ . is best carried out in acetone-water mixtures at pn 11-12. Under these conditions, most estrogens show maximum fluorescence intensity in about 30 minutes at room temperature, with a limit of detection of about 0.5 pg/ml. A semi-automated fluorometric method for detecting the total estrogen content of plasma during late pregnancy has been reported124.
DOUGLAS BOTH
158
4.0
SOLUTION PROPERTIES
4.1
SOLUBILITY
Table 6 gives the ~ o l u b i l i t y ~ of~ estrone ~ ’ ~ ~ ~in ~ ~ derived various solutions and solvents. E p ~ h t e i n lhas equations that demonstrate the correlation between aqueous solubility and Van der Waals molecular volume. The solubilization128’129 of estrone in aqueous solutions of different association colloids has been studied. The solubilization of estrone in sodium dodecyl sulphate at 40°C and in Tween 20 at 2OoC were reported to be 0.014 and 0.0068 moles of estronel mole of micellar substrate respectively. TABLE 6 SOLUBILITY OF ESTRONE (BY G.L.C.) Solvent
Temp OC
tetrahydrofuran p-dioxane acetone chloroform methylene chloride absolute ethanol 95% ethanol methano1 ethyl ether toluene cyclohexane hexane water 4.2
30 30 30 30 30 30 40 30 30 30 30 30 25
Solubility mg/mL 48.336 19.200 11.535 15.680 6.384 3.516 6.227 4.041 2.127 1.011 0.023 0.004 0.0008
PARTITION COEFFICIENTS
Table 7 gives selectedlUo partition coefficients for estrone in various solvent systems. The partition coefficient (K) is defined here as the concentration of solute in the upper phase/concentration of solute in the lower phase. 4.3
MOLECULAR VOLUME
The average apparent molecular volume130 of estrone in a solution of methanol at a concentration of 0.0207 lpgles/1000 g of solvent was determined to be 372.5 A /molecule with a precision of 2.5%. It has been shown in
159
ESTRONE
steroids that the average molecular volume per atom of carbon is constant and that the molecular volume decreases as the number of substituted hydroxyl groups increases. TABLE 7 PARTITON COEFFICIENTS Solvent System
Partition Coefficient(K)
etherll.5M sulfuric acid 100 etherjwater 90 ether/pH 10 carbonate buffer 28 ether/l.OM sodium hydroxide 0.5-0.6 n-hexanejwater 6.8 petroleum etherjwater 3.34 petroleum ether/50% water50% methanol 0.06 petroleum ether/30% water70% methanol 0.56 40% ethyl acetate-60% n-hexanej 50% ethanol-50% water 2.2 10% ethyl acetate-90% cyclohexanej 40% ethanol-60% water 1.8 30% ethyl acetate-70% cyclohexanej 50% ethanol-50% water 2.1 40% ethyl acetate-60% cyclohexanej 50% ethanol-50% water 2.6 50% ethyl acetate-50% cyclohexanel 50% ethanol-50% water 4.2 10% methanol-90% waterjcarbon tetrachloride 0.01 20% methanol-80% waterjcarbon tetrachloride 0.04 30% methanol-70% waterjcarbon tetrachloride 0.07 40% methanol-60% waterlcarbon tetrachloride 0.15 50% methanol-50% waterjcarbon tetrachloride 0.33 70% methanol-30% waterjcarbon tetrachloride 1.3 90% methanol-10% waterjcarbon tetrachloride 2.8 70% ethanol-30% waterjcarbon tetrachloride 0.67 70% ethanol-30% water/5% chloroform95% carbon tetrachloride 0.40 70% ethanol-30% water/lO% chloroform-
DOUGLAS BOTH
160
90% carbon tetrachloride 70% ethanol-30% water/20% chloroform80% carbon tetrachloride
0.31
0.17
4.4 HEAT OF FORMATION AND COMBUSTION The heat of combustion131 for estrone, using a microbomb calorimeter, was determined to be AHo= 2355.3 2 3.1 Kcal/mole. Using this information the heaf of formation was calculated to be -88.0 Kcal/mole. 4.5
THE ACID IONIZATION CONSTANT
The reported acid ionization constant (pK ) of estrone shows great variation ranging from 9.36 to 11.8. Previous132’1 3 3 methods of measurement included: back titration, conductimetric and most recently U.V. spectrophotometric methods. Recent workg9’1 3 4 places the pKa between 10.34 and 10.914. The most recent spectrophotometric determination135 reports the K to be 10.77 2 0.02 with seven determinations. Egorova1%a discussed the correlation between structure and the dissociation constant.
4.6 STABILITY Estrone in most cases is a relatively stable compound. A 0.1% wlw solution of estrone in chloroform was shown to be stable for approximate1 3 years by TLC, using ten different solvent s sternslg7. Estrone dissolved in sesame oil and in showed little change in physiological activity after six months of storage at room temperature. Four ml of blood140 were mixed with 1 ml ACD stabilizer (2.13 g sodium citrate, 0.74 g citric acid, 2.0 g glucose1100 ml water), 1 ml of this mixture was then incubated for 10 hours at 37’C with 1 pg of estrone and estradiol and 10 mg glucose. The degradation of estrone was twice that of estradiol with fresh blood and half that of estradiolwith 42 day old blood. In the absence of glucose degradation of estrone was half that of estradiol with fresh as well as stored erythrocytes. Estrone141 is not reduced by enzyme extracts of hog ovaries, beef suprarenal glands or bull testes.
ESTRONE
161
Estrone dissolved in absolute alcohol decomposes when exposed to ultraviolet radiation. When estrone in d i o ~ a n e lis ~ ~irradiated with ultra-violet light at 313 nm it forms 13a-estrone (lumiestrone), which is reversible when unfiltered ultraviolet light is used. Creepage143 of estrogens on glassware occurs only in uncovered vessels in the presence of salts and absence of proteins. Larger amounts of creepage occurs in freshly cleaned vessels and when small volumes of concentrated solutions are placed in larger vessels. No sorption onto glass from buffered aqueous solution or decomposition in tightly closed containers in the absence of proteins have been found. Silanization of glassware can drastically reduce creepage. The ~ t a b i l i t y ’ ~ ~of ’ ’estrone ~~ on TLC plates has been studied. Estrone decomposes as a result of contaminants present in air and not a result of the oxadative effect of oxygen to any great extent.
5.0 CHROMATOGRAPHIC AND OTHER SEPARATION BASED ANALYSIS 5.1
COLUMN CHROMATOGRAPHY
Estrone has been separated from other estrogens in a variety of matrices using column chromatography. Column chromatography has also been used to concentrate or separate prior to analysis by HPLC, G.C., RIA or TLC. Thus, column chromatography serves to remove interfering compounds and to concentrate prior to detection by a more sensitive method. Table 8 gives selected examples of column chromatographic procedures. TABLE 8 SELECTED COLUMN CHROMATOGRAPHIC PROCEDURES Reference
Description
145
Separation prior to G.C., TLC, using anion exchange resin (AGl-X2 cl), elution with a methanollwater solution.
146
Separation of estrogens prior to G.C. on AGlX2 column, methanol water elution.
147
Purification after hydrolysis on Merckogel 6000, followed by separation on Sephadex LH 20, elution with
DOUGLAS BOTH
162
heptane-chloroform-ethanol-water mixture.
148
Separation of conjugated urinary estrogens on Sephadex G-15, elution with 0.01M ammonium formate.
149
Separation of estrogen conjugates on DEAE-Sephadex using gradient elution (0-0.4g) sodium chloride.
150
Separation of androgens, estrogens, and progestrogens on Lipidex elution with hexane-chloroform mixture.
151
Separation of Sephadex LH-20 using methylene chloride elution.
152
Separation of 14 testicular steroids using celite column prior to HPLC.
153
Analysis of steroid mixtures using silicic acid column eluted with gradient of ethyl ether.
154
Extraction of estrogen conjugates from pregnancy urine using amberlite XAD-2 resin and elution with 30% ethyl alcohol.
155
Separation of free estrogens on Sephadex LH-20 eluting with cyclohexane-benzene-methanol mixture,
156
Purification of urine for quantification of complete estrogen profile, using Sephadex G-25, DEAE-Sephadex A-25, Sephadex LH-20 and DEAE Sephadex A-25 followed by G.C. or selective ion monitoring.
157
Separation of C CI9 and C steroids using Sephadex 2A120 and eluied with n-hexane-ethyl acetate-methanol mixture.
163
ESTRONE
158
Separation of U.V. absorbing constituents in urine on Diaion CDR-10 using a linear gradient of ammonium acetate (0-6M).
159
A two step anion exchange separation for the purification of estrogens using DEAE-Sephadex A-25 prior to capillary gas chromatography.
160
Separation of radioactive steroids and steroid conjugates from urine using Amberlite XAD-2 and DEAE- Sephadex A-25 with NaCl gradient elution.
161
Separation of conjugated estrogens in urine using Sephadex G-25, DEAE-Sephadex and Sephadex G-15.
162
Separation of estrone, estradiol, and estriol on florisil 60 mesh column, elution with methyl chloride- ethanol solution.
163
Separation of steroid hormones from plasma using a Merck extrelut column. Elution with ethyl ether.
5.2
THIN LAYER CHROMATOGRAPHY
Thin layer chromatography (TLC) can be used to separate complex mixtures or provide inital sample purification for further more sensitive separation and detection. Reviews of TLC steroid methods are found in r e f e r e n ~ e s l ~ ~ ’Sander166 ~~~. describes the theory and applications of reverse phase TLC. Hais167 has studied the relationship between chemical structure and TLC sequence in single and multicomponent systems for the separation of a group of 6-estrane and 10-androstane derivatives. Table 9 summarizes selected TLC separation methods. TABLE 9 TLC SEPARATION METHODS Reference 168
Description Separation and purification of urinary estrogens on silica gel H-ascorbic
DOUGLAS BOTH
164
acid, developed in benzene containing 5 % ethanol, detection by gas chromatography. 169
Silica gel containing ethanolic ammonium bisulfate, development in benzene-ethanol (85:15) using a spectrodensitometer for detection.
170
Detection using an automatic conductivity detector.
171
Separation of steroid mixtures on silica gel G or aluminum oxide G with phosphor 6-115 added to coating.
172
Separation of steroids on starch bound silica gel using phosphomolybdic acid visualization.
173
Separation of free estrogens and estrogen acetates on silica g e l containing dichlorofluoroscein, using a 15% ethanol in benzene and 10% isopropyl ether in benzene system.
174
Separation of a variety of steroid hormones on silica gel containing 5% gypsum with development in a variety of solvent systems.
175
Separation of free steroids and steroid heptafluorobutyrates on silica gel G and GF using benzene: ethyl acetate (60:40), (9O:lO) and chloroform: acetone (95:s).
176
Separation of steroids on Gelman sheets in a chloroform: acetone (30:l) system using silicotungstic acid visualization.
177
Detection of estrogens on silica gel by coupling the estrogens to the diazonium compound fast dark blue R salt. Development twice in diethyl ether-cyclohexane (80:ZO).
165
ESTRONE
178
Simultaneoug separation of common mammalian A -3-oxosteroids and estrogens of adrenal, testicular, ovarian and placental origin.
179
Separation of estrogens on silica gel G using one and two dimensional development, in five different solvent systems.
180
Separation of antithyroid drugs and estrogens from animal tissue extracts by HPTLC with a detection limit of 10-200 ng.
181
Determination of separated estrogens on silica gel by measurement of their dansyl derivative fluorscence.
182
Identification of nine major components of conjugated estrogens on Kieselguhr G plates containing sodium hydroxide and impregnated with formamide.
183
Separation of estrogens, androgens, gestogens and corticoids on dimethyl-, octyl- and octadecylsilyl silica gel using a methanol-water solvent system.
5.3
HIGH PERFORMANCE LIQUID CHROMATOGRAPHY
Estrone and many steroids exhibit rather strong U.V. absorption. However, U.V. detection of these compounds in physiological media is often limited because they are present in low concentration, and the media often contain other compounds which interfere with simple U.V. detection. Thus for many other methods the sample must be pure or highly concentrated. It is for these reasons the HPLC analysis of steroid hormones is a preferred method. HPLC analysis allows for sensitive detection on relatively "dirty" samples. A simple preparative HPLC column connected to a fraction collector can clean and concentrate even the "dirtiest" of samples. Derivatization can greatly enhance the sensitivity for detection by resulting in improved U . V . absorption or fluorescence, or altered retention time or oxidation potential to allow for electrochemical detection. The
DOUGLAS BOTH
166
great number of combinations that can be achieved by varying the parameters of mobile phase, column and detector allow for the separation and detection gf complex mixtures of steroid hormones. Several papersla4 186 review the analysis of estrogens by HPLC. Table 10 gives selected HPLC methods for the analysis of estrone and steroid mixtures containing estrone. TABLE 10 SELECTED HPLC METHODS Reference
Description
187
Analysis of estrogens in tablet and injectable forms by measurement of their dansyl derivatives.
188
Separation of esterified estrogens in bulk mixtures and combination drug preparations by reverse phase HPLC.
189
Analysis of estrogens in pregnancy urine
190
Separation of estrogen conjugates using strong anion exchanger column.
191
Separation of 14 testicular steroids including estrone by reverse phase HPLC
.
.
192
Determination of trace estrogenic hormones using voltammetric detection.
193
Separation of various estrogen mixtures by reverse and normal phase.
194
Separation of estrogen mixtures using a mobile phase containing silver nitrate.
195
Separation of catechol estrogens and detection with electrochemical detector.
196
High speed L.C. separation of equine estrogens including estrone.
ESTRONE
167
197
Purification of 19 hormonal steroids prior to immunoassay.
198
Retention behavior for 43 steroids on bonded reverse phase systems.
199
Reverse phase determination of estrogens.
200
Separation of estrogens in primate urine.
201
Determination of unconjugated estrogens in amniotic fluid using an amperometric detector.
5.4 GAS-LIQUID CHROMATOGRAPHY Numerous analytical methods for the gas chromatographic analysis of estrone and estrogen mixtures containing estrone have been reported. Most methods utilize a glass column typically 1-3 meters in length or a glass capillary column 20-30 meters long. Estrone is considered to be thermally stable, therefore instability on the column appears to be of little concern. It is usually the stability of other compounds of interest that quite often limit the column operating temperature. Most analyses are run at column temperatures of 140-260°C. Estrone has been chromatographed in derivatized and free forms. The derivatized forms offer improved thermal stability, lower detection limits and decreased chance of irreversible absorptivity losses. Therefore they are quite suited for use with selective detectors such as electron capture. Estrone has been frequently detected as heptafluorobutyrate, chloroacetate, trimethylsilyl ethers, trifluoroacetates and methoxamine-trimethylsilyl derivatives. Each derivative is useful in specific applications, but not all derivatives are of equal value in a given separation and quantitation. These same comments apply to the many types of column supports and stationary phases. In general, the high performance, acid washed, silanized supports with particle sizes of 80-120 mesh having 2500 or more theoretical plates appear to work well. Many stationary phases which appear useful generally are those
DOUGLAS BOTH
168
of medium olarity and higher thermal stability. Several papers202'506 review solid supports for steroid analysis. Several papers185'207-214 review the separation and identification of steroids. Papers which review retention times of various steroid derivatives and derivative Table 11 gives applications include references 215-226. selected methods of analysis of various estrone containing samples. TABLE 11 SELECTED GAS-LIQUID CHROMATOGRAPHY METHODS Reference 227
Description Estrogen separation from human urine as
0-methyloxime-heptafluorobutyrate derivatives.
228
Separation of submicrogram amounts of steroid hormones using non-selective stationary phase.
229
Separation of estrogen stereoisomers as heptafluorobutyric derivatives using a completely automated splitless glass capillary system.
230
Separation of estrogens using a solid injection system.
23 1
Plasma estrogen measurement as heptafluorobutyrate derivatives.
232
Urinary estrogen determination on non-pregnancy urine. Extraction and enzymatic hydrolysis followed by silylation of concentrate.
233
Quantitation of urinary estrogens throughout pregnancy. Enzymatic hydrolysis and ion-exchange followed by derivatization as heptafluorobutyric anhydride derivatives.
234
Analysis of estrone in dermatological products using internal-external standard ratioing. Cream or lotion
ESTR0NE
169
analysis by hydroxide extraction and filtration prior to G.C. 235
Analysis of conjugated estrogens using dual derivatization and dual injection. Enzyme hydrolysis and derivatization as trimethylsilyl and methoxaminetrimethylsilyl steroids.
236
Resolution of equine estrogens using a short glass capillary column coated with Silar 1OC. Detection of oxime-trimethylsilyl ether derivatives using a flame ionization detector.
5.5
GAS CHROMATOGRAPHY-MASS SPECTROMETRY
-
Combined gas chromatography mass spectrometry (GC-MS) using the technique of selective ion monitoring or fragmentography has been applied for the detection of estrogens in the lower picogram range. A typical method involves extraction and derivatization of the estrogens followed by separation by gas chromatography and detection using the mass spectrometer as a detector by monitoring selected peaks of the mass spectrum.
It was shown237 that the methyl and trimethylsilyl ether estrogen derivatives of fully trimethylsilylated estrogen derivatives are more suitable than methyl ether, acetate or trifluoroacetate estrogen derivatives for use in combined GC-MS. Several selected methods are listed in Table 12. TABLE 12 SELECTED COMBINED G.C.- M.S. METHODS Reference
Description
238
Determination of estrogens in the lower picogram range using isotopically labeled internal standards.
239
Comparison of a radio-gas chromatography method for estrogens in tissue to G.C. M.S. method.
-
DOUGLAS BOTH
170
240
Determination of steroid hormones in plasma and urine.
241
Determination of unconjugated estrone, 178-estradiol and estriol in blood.
242
Identification of estrogens isolated from pregnant mares' urine.
243
Determination of interfering estrogenic compounds in tablet preparations of conjugated and esterified estrogens.
244
Determination of estrone and 178-estradiol in seminal plasma of man, bull and boar.
6.0 RADIOASSAY
Radioimmunoassay (RIA) methods for the determination of estrone in biological samples are quite sensitive. Detection limits for estrone are in the picogram range, with the use of high affinityfspecific antisera. There are a great number of methods for the assay of estrone and other steroid hormones in the literature, Table 13 lists selected methods. Presently radioimmunoassay is the most widely used technique for the quantitation of picogram quantities of steroid hormones. However, because of the inconveniences associated with the use and disposal of radioactive compounds and the high per assay costs, enzymeimmunoassay and fluorescence immunoassay methods have been increasing in popularity. For recent reviews on fluorescence-, enzyme- and radio-, immunoassay methods see references (245-253). TABLE 13 SELECTED RADIOASSAY METHODS Referenre
Comment
254
Non-chromatographic RIA for total estrone in plasma.
255
Determination of estrone and 178-estradiol in pregnant and non-pregnant plasma.
171
ESTRONE
256
Determination of estrone and 178-estradiol in urine.
257
Determination of total estrogens in urine.
258
Non-chromatographic R I A for estrone and 17B-estradiol in plasma.
259
Solid phase R I A for estrone and 178-estradiol in plasma.
260
Total estrone in non-pregnant peripheral plasma.
261
Determination of estrone in male saliva.
262
Determination of estrone and equilin in plasma after administration of a conjugated equine estrogen preparation.
263
Determination of estrone and estradiol in plasma.
264
Determination of estrone 178-estradio1, estriol, testosterone, 5a-dihydrotestosterone and androstenedione in plasma after extraction and separation.
265
Sequential R I A for unconjugated and conjugated estrone, 178-estradiol and estriol in male plasma.
266
Determination of total urinary estriol.
267
Simultaneous R I A for progestins, androgens and estrogens in rat testis.
268
Determination of oestrone in the plasma of rhesus monkey.
269
Determination of estrone, equilin and dehydroepiandrosterone in peripheral plasma of pregnant pony mares.
DOUOLAS BOTH
172
270
Enzyme immunoassay for total estrogens in pregnancy plasma.
271
Determination of estrone and estradiol in bovine peripheral plasma.
272
RIA of estrone and 17B-estradiol comparison of method with fluorimetry.
273
RIA of estrone in plasma comparison of different methods.
274
Simultaneous determination of six steroids in plasma.
275
Separation and extraction prior to RIA for estrone, 17B-estradiol and 17a-estradiol in plasma.
276
Determination nf estrone, 17a-estradiol or 176-estradiol in human and ruminant plasma.
277
Simultaneous measurement of five steroids in avian plasma.
278
Immunoenzymological assay of steroids in plasma.
279
Non-chromatographic determination of unconjugated estrone, 17B-estradiol and estriol in plasma.
280
Determination of steroids in plasma of the monkey.
281
Determination of conjugated estrogens in plasma of cows.
7.0 COLORIMETRIC ANALYSIS Colorimetric methods of analysis were once very popular, but with the advent of more sensitive separative and instrumential methods, colorimetric analysis today is of less importance. Table 14 gives s e l e ~ t e d ~colorimetric ~ ~ ’ ~ ~ ~ reactions. It should be noted that these colorimetric reactions
173
ESTRONE
generally are not selective to estrone, and reaction with other steroids is quite possible. TABLE 14 SELECTED COLORIMETRIC REACTIONS Reaction with 2,4-dinitrophehylhydrazine and nitromethane at 100°C for 15 min, Xmax = 565 nm, 13 pg gives 0.3A. Reaction with 4-nitrophenylhydrazine and benzyltrimethylammonium hydroxide to give a pink color. Xmax - 530 nm, 245 ug gives 0.3A. Reaction of 2,4-dinitrophenylhydrazine and sodium hydroxide. Amax = 420 nm, 64 pg gives 0.3A. Reaction with 1:l mixture of 0.5% 1-nitroso-2-napthol in ethanol and 0.05% sodium nitrate in 3.5 g nitric acid. Xmax = 450 nm, 11Opg gives 0.3A. Reaction of diazobenzene-p-sulfonyl chloride in alkaline solution. Xmax = 510 nm. Reaction with a 1:l mixture of 0.6% aqueous potassium ferricyanide and 0.9% aqueous ferric chloride hexahydrate. Xmax = 720 nm, 11 ug gives 0.3A. Zimmerman reaction - 1% solution of 3,5-dinitrobenzoic acid in 40% aqueous solution of benzyltrimethylammonium hydroxide. Xmax = 530 nm, 175 pg gives 0.3A. Reaction with salicyloylhydrazide to yield blue fluorescence, excitation at 340 nm, emission at 420 nm. Reaction with 1,3,5-trinitrobenzene Xmax = 475 nm, 110 Vg gives 0.3A. Reaction with 3,5-dinitrobenzoic acid in aqueous benzyltrimethylammonium hydroxide solution, Xmax = 530 nm. Reaction at 100°C in a 10% solution of potassium guaiacolsulphonate in concentrated sulphuric acid. Xmax 500 nm. Reaction when heated in the presence of a 2% soluton of hydroquinone in 66% sulphuric acid. Xmax = 500-550 nm.
=
DOUGLAS BOTH
174
8.0
TITRIMETRIC ANALYSIS
Estrone was determined285 in pharuceutical preperations by titration after extraction with ethanol and alkalinizaiton with sodium hydroxide to pH 11. It was first complexed with lead citrate and then determined by back titration with EDTA to a eriochrome black end point. Estrone was also determined286 in the parts per million range by titration with bromine in a methanol-water solution containing hydrochloric acid and sodium bromide using biamperometric end point detection. 9.0
ACKNOWLEDGEMENTS
I wish to thank Dr. Mira Szyper for her in-depth critical reading and comments. The comments and reading of Dr. Glenn Brewer, Mr. Ray Poet, Dr. Joel Kirschbaum, Mr. Solomon Perlman, Dr. Jack Isidor, Dr. Mohammed Jemal and Mr. Richard Koski are greatly appreciated. Special thanks to Quentin Ochs for the x-ray diffraction work, Dr. Michael Porubcan for the IR, Gloria Jennings for the NMR and Dr. Phillip Funk for the mass spectroscopy work. Special thanks to Dr. Sy-Rong Sun, Director of the USP Drug Research and Testing Laboratory, for suppling information concerning the USP Standard Estrone. Special thanks to Arminda Rubial for her translation of several important papers. Thanks to Phyllis Gottstine and Muriel George for getting those hard to get references. 10.0
1.
References A.Q. Maisel, "Hormone Quest," Random House, N.Y. (1965)
81,
2.
E. Allen, J. h e r . Med. Assoc.
3.
S . Aschheim et al., Klin. Woschr.,
4.
E.A. Doisy et al., her. J. Physiol.,
5.
A. Butenandt, Naturwissenschaften, 17,879 (1929)
6.
A. Butenandt, Trends Biochem. Sci.,
819 (1923)
5,
1322 (1927)
90, 2
A, 215
(1929)
(1979)
ESTRONE
7.
175
S.A. Thayer et al., Proc. SOC. Exp. Biol. A. Medi, 735 (1930)
8.
H. Inhoffen, Ber.,
9.
G.
74,
1911 (1941)
Anner et al., Experientia.,
4,
25 (1948)
10.
El S . Amin, Phytochemistry, 8(1),
11.
A. Gawienowski et al.,
12.
E.P. Haussler, Festschrift E.C. Barell, 327 (1936)
13.
W. Velle et al., Acta Endocr.,
14.
EL S. Amin et al., Phytochemistry, 18(2), 344 (1979)
15.
D. Beall, Nature, 144, 79 (1939)
16.
W. Westerfield et al., J. Biol. Chem.,
295 (1969)
w.,80,685 33, 277
(1969)
(1960)
126, 195
(1938)
34,
17.
D. Beall, Biochem. J.,
18.
M.H. Briggs, "Steroid Biochemistry and Pharmacology", Academic Press, N.Y. (1970)
19.
W.R. Butt, "Hormone Chemistry", 2nd ed, Wiley, N.Y.
1293 (1940)
(1975) 20.
D. Greenberg, "Metabolic Pathways" Vol. 2, 3rd ed, Academic Press, N.Y. (1968)
!1.
B.R. Bhavnani et al., "Steroid Biochemistry," CRC Press, Boca Raton, Florida (19791, pp 1-51
22.
T. Omura et al., Federation Proc.,
23.
E.D. Plotka et al., Clin. Chem. Acta,
24.
A.A. Sandberg, Recent Prog. Horomone Res.,
24,
1181 (1965)
3, 287
(1973)
13,209
(1957)
86, 385
25.
A. Sneddon, Biochem. J.,
26.
P.I. Mussey. "Formation and Metabolism of Steroid Conjugates", CRC Press, Boca Raton, Florida (1979)
(1963)
DOUGLAS BOTH
176
27.
K.D. Manchester, "Scientific Tables," 6th ed, CIBA-Geigy Limited, Arsley, N.Y. (1962)
28.
K.J. Ryan et al., Endocr.,
29.
W. Velle et al., Acta Endocr. Copenh.,
30.
S.
31.
Pochi et al, J. Clin. Endocr.,
32.
A.A. Sandberg et al.,
33.
K. Lisse, Endokeinologie., 55 (3-4),
34.
J.B. Brown, Mem. SOC. Endocr.,
35.
J.B. Brown, et.al., Recent Prog. Hormone Res.,
52, 277
Ichii et al., Anal. Biochem.,
(1953)
5,
25,
33,
277 (1960)
422 (1963) 1660 (1965)
B., 18,253
2, 1
(1958) 145 (1969) (1955)
2,
337 (1962) 36.
H. Inhoffen, Ber.,
37.
G.
38.
N. Applezweig, "Steroid Drugs", McGraw Hill, N.Y.
74,
1911 (1941)
Anner et al., Experientia.,
A,
25 (1948)
(1962)
15,292
39.
E.H. Hershbery et al., J. Org. Chem.,
40.
P.I. Bell Kevich et al., Vestsi. Akad. Navuk. BSSR, Ser. Khim.-Navuk, 2, 53 (1977)
41.
I. Yukio et al., Hakko to Kogyo, 38, 1117 (1980)
42.
S.
43.
A. Mondon, Angew. Chem.,
44.
Y. Osawa, Kagaku No Ryoiki, 13, 277 (1959)
45.
D.K. Banerjee, Proc. SOC. Biol. Chemists (India), 19,
Herchel, Trans. N.Y. Acad. Sci., 27(5),
64,
(1950)
546 (1965)
121 (1952)
4 (1960) 46.
T.B. Windholz, Angew. Chem. Int. Ed.,
2, 353
47.
R.L. Funk, J. Am. Chem. SOC., 101(1),
215 (1979)
48.
J. Das et al., Can. J. Chem., 54(24),
3308 (1979)
(1964)
ESTRONE
177
49.
L. Dubas, Diss. Asstr. Int. B., 39(12,Ptl),
50.
B.K. Bhattacharyya, Nature, 170, 710 (1952)
51.
Swiss Patent 266,510, (July 1950)
52.
Takeda Pharmaceutical Industries Ltd., Japan Patent 10,324
53.
Y. Morita et al.. Japan Patent 79,119,446 (Septa 17, 1979)
54.
Yutaka Mizuhara, Japan Patent 76,149,257 (Dec. 22, 1976)
55.
Takeda Pharmaceutical Ind., German Patent 1, 110,639 (July 13, 1961)
56.
Yoshimi Morita, Japan Patent 8,049,398 (Oct. 3, 1978)
57.
Roussel-Uclaf, French Patent 1,290,876 (Nov. 15, 1963), CA 64: 14566 g
58.
Searle, British Patent, 1,211,356 (Nov. 4, 1970) 74: - 63178N
59.
R. Bucourt et al., C.R. Acad. Sci., Paris Ser. C,
60.
(1979)
265(15),
CA
834 (1967)
A. Wartburg, Helv. Chim. Acta., 11439h
58: -
5923
46,
591 (1963),
CA
61.
C.
Djerassi, Syntex S . A . , U.S. Patent 2, 788,352 (Apr. 9, 1957)
62.
P. Bartlett, Journal Am. Chem. SOC., 95, 750 (1973)
63.
Syntex Corp., U.S. Patent 3,279,621 (Apr. 23, 1968)
64.
Syntex Corp., French Patent 1,400,433 (May 28, 1965) CA 63: 11667
65.
T. Kamejani, J. Am. Chem. SOC., 99, 10,3461 (1977)
66.
G. Zollner, Hungary Patent 150,991 (Nov. 1963)
67.
P. Talalay, U.S. Patent 2,796,381 (June 18, 1957)
DOUGLAS BOTH
178
68.
C. Vezina, American Home Products Corp., US Patent 3,398,054 (Aug. 20, 1968) CA 69:85436
69.
N.V. Organon, Netherland Patent 6,810,710 (Jan. 28, 1970), CA 73:2677
70.
A. Horeau, C.R. Acad Sci, Sec C, 269(11), 602 (1969)
71.
P. Bartlett, J. Am. Chem. SOC.,
72.
H. Hosoda, J. Chem. SOC. Chem. Commun., (1974)
73.
D. Zh. Lebedeva, Izv. Arad. Nauk. SSR, Ser. Biol., 767 (1970)
74.
N.V. Organon, Netherland Patent 297,332 (May 1965), CA 63:10635
75.
R. Dodson, G.D. Searle and Co., U.S. Patent 2,805,231 (Sept. 3, 1957), CA 52: 2947
7b.
K. Wakabayashi, Mitsubishi Chemical Instustries, German Patent 2,537,254 (Mar. 4, 1976), CA 85: 94609
77.
B. Busetta et al., Acta Crystallogr. Sect. B, 29(Pt2), 298 (1973)
78.
G. Van den Bossche, Bull SOC. Roy. Sci. Liege, 40(11-12), 614 (1971)
79.
B. Busetta et al., C.R. Acad Sci Ser C, 271(25), (1970)
80.
B. Busetta, M.,272(13),
81.
B. Busetta,
82.
Q. Ochs, Personal Communication
83.
J. Parsons et al., Henry Ford Hosp Med. Bull., 12(4), 459 (1964)
84.
M. Brandstaetter-Kuhnert et al., Mictochem. J.,
85.
B. Lorant, Z. Ernaehrungswiss, 60, 258 (1966)
95,
18, 7501 (1973)
14,546 2,
1558
1211 (1971)
M.,274(2), 153 (1972)
105 (1965)
90,
ESTRONE
179
4-5,
86.
G. Liptay et al., Mikrochim Acta,
87.
Dr. Sy-Rong Sun, Personal Communication
88.
G. Van den Bossche, Z. Kristallogr., Kristallgeom., Kristallphys., Kristallchem., 136(5-6), 411 (1972)
89.
G. Jennings, Personal Communication
90.
Hans J. Reich et al., J. her. Chem. SOC., 91(26),
926 (1966)
7445 (1969) 91.
W.B. Smith, Annu. Rep. NMR Spectrosc, 8, 199 (1978)
92.
T.A. Wittstruck et al., J. Org. Chem.,
93.
E. Breitmaier and W. Voelter, 1113C NMR Spectroscopy," Vol. 15, Verlag Chemie, NY (1978)
94.
J. Al-Rawi et al., Steroids, 28(3),
95.
P.T. Funke, Personal Communication.
96.
F.J. Brown, Diss. Abstr. Int. B., 41(8),
97.
M. Porubcan, Personal Communication
98.
R.F. Furchgott et al., J. Biol. Chem., 164, 621
38, 8
(1973)
359 (1976)
3030 (1981)
(1946) 99.
A.R. Hurwitz et al., J. Pharm. Sci., 66(5),
624
(1977) 100.
L. Engel, "Physical Properties of Steroid Hormones", MacMillan Co., N.Y. (1963)
101.
W.F. Ulrich, Develop. Appl. Spectry.,
102.
E.E. Sandmeyer, Med. Exp., 19(4), 210 (1969)
103.
E. Foltz, J. Am. Chem. SOC., 77, 4359 (1955)
104.
K. Nagasawa et al., Eisei Shikenjo Hokoku,
2, 130
(1963)
2,241
(1963) 105.
S.S.M. Hassan, Fresenius' Z. Anal. Chem., 269 (5), 363 (1974)
DOUGLAS BOTH
180
84, 3,
106.
G. Andras et al., Magy. Kem. Foly.,
107.
A. Weinreb et al., Photochem. Photobiol.,
141 (1978)
26,
567
(1977)
2, 231 (1969) Photobiol., 3,313
108.
A. Weinreb et al., Chem. Phys. Lett.,
109.
A. Weinreb et al., Photochem. (1974)
26, 853
110.
J. W. Goldzieher et al., Anal. Chem.,
111.
J.W. Goldzieher et al., Endocrinology, 53, 527 (1953)
112.
S.
113.
W.R. Slaunwhite Jr. et al., J.
(1954)
18,1146 (1953) Biol. Chem., 191,627
Bernstein et al., J. Org. Chem.,
(1951) 114.
R. Bates et al., Endocrinology, 2, 182 (1950)
115.
R. Scholler et al., Bull. SOC. Chim. France, 189 (1960)
116.
W. Eechaute et al., Steroids, 13(1),
117.
S.
101 (1969)
DeLauzon, Bull. SOC. Chim. Biol., 52(2),
181
(1970) 118.
R. Toccafondi et al., Biochem. Appl., 12(2), 63 (1965)
119.
L. Dubey et al., Fresenius' 2. Anal. Chem., 252, 309 (1970)
120.
T. Uete et al., J. Biochem., 67(1),
121.
T. Miura et al., Bunseki Kagaku, 29(9), 593 (1980)
122.
S.
Fishman, J. Pharm. Sci., 64(4),
123.
S.
Fishman, EDRO SARAP Res. Tech. Rep.,
124.
C. Goutte-Coussieu et al,, Clin. Chem., 26(2),
(1970)
674 (1975)
L,
13 (1976)
(1980) 125.
M.W. Ruchelman, Anal. Biochem, 19(1), 98 (1967)
190
ESTRONE
181
126.
S . T . Lia et al., J. Pharm. Sci., 66(5),
127.
N.A. Epshtein et al., Khim-Farm. Zh., 13(10), 57
624 (1977)
(1979) 128.
C. Blomquist et al., Acta Chem. Scand.,
18,2404
(1964) 129.
L. Sjoblom, Proc. Scand. Symp. Surface Active Chem. 2nd, Stockholm 1964, 210 (1965)
130.
R.A. ROUX, Bull. SOC. Pharm. Marseille, 16(62),
135
(1967)
E.,19(73),
131.
D. Paoli et al.,
132.
G.F. Marrian, Biochem.J.,
133.
A. Butenandt et al., Z. Physiol. Chem.,
24,
5 1 (1970) 1019 (1930)
223, 147
(1934) 134.
R.Y. Kirdani et al., Arch. Biochem. Biophys., 118(1), 33 (1967)
135.
K.M. Lewis et al., Steroids, 34(5), 485 (1979)
136.
V. Egorova et al., Izv. Akad. Nauk. SSSR, Ser Khim, 3 , 726 (1972)
137.
P. Ban et al., Farmacia, 26(3),
138.
W. Pschyrembel et al., Z. Physiol. Chem.,
155 (1978)
315, 232
(1959)
2, 152
139.
A. E. Wilder et al., J. Endocrinol.,
140.
H.J. Raderecht et al., Acta Biol. Med. Ger., 16(6),
(1947)
590 (1966) 141.
J. Marker et al., J. Am. Chem. SOC., 3, 1901 (1938)
142.
H. Wehrli et al., Helv. Chim. Acta; 45, 385 (1962)
143.
S. Kushinsky et al., Clin. Chem., 20(12),
144.
J. Coyotupa et al., Anal. Biochem, 34, 7 1 (1970)
145.
W.R.
Eberlein, Steroids, 14(2), 553 (1969)
1528 (1974)
DOUGLAS BOTH
182
146. G. Pierrat et al., Ann. Biol. Clin., 34(6), (1976)
423
147. H.O. Guenther, Fresenius' 2. Anal. Chem., 290(5), (1978) 148. W. Paul et al., J. Chromatogr., 149. R. Hobkirk, Steroids, 14(2),
45, 381 (1969)
191 (1969)
150. R.J. Fairclough et al., J. Chromatogr, (1977) 151. A.R. Bourne,
G.
133,412
w.,92, 465 (1974)
152. R.C. Cochran et al., 153.
389
Caviana et al.,
u.,173,175 (1979)
w.,60,
179 (1971)
154. Y. Osawa et al., Steroids, 15(1), 73 (1970) 155. G.S. Krol et al., J. Pharm. Sci., 59(10), 156. T. Fotsis et al., J. Steroid Biochem., 157. H. Gips et al., J. Chromatogr.,
1483 (1970)
12, 503
193,322
& l 158. K. Seta, J. Chromatog. Biomed. Applic., , (1980)
(1980)
(1980) 311
159. P. Jarvenpaa et al., J. Steroid Biochem., ll(5-6), 1583 (1979) 160. S.J. Baker, Steroids, 32(1), 95 (1978) 161. W. Paul et al., J. Chromatogr.,
45, 392 (1969)
162. A. Brancaclid et al., Biochim. Appl., (1960)
7(5),277
163. R. Wehnet et al., Clin. Chim. Acta, 93(3),
429 (1979)
164. E. Heftmann, "Thin Layer Chromatography of Steroids," Elsevier Publishing Co., NY (1965), pp 179-192 165. J. Touchstone, "Quantitative Thin Layer Chromatography," Wiley-Interscience, J. Wiley and Sons, N.Y. (19801, pp 131-153
ESTRONE
166.
183
L.C. Sander et al., J. Liquid Chromatog.,
4,
63
(1981) 167.
I.M. Hais et al., presented at The Symposium on the Analysis of Steroids, Eger, Hungary, May 1 9 8 1
1 6 8 . C.E. Morreal et al., Steroids, (1975) 169.
J.C.
50, 421
Touchstone et al., J. Chromatogr.,
66,
172
(1972)
u., 53, 3 9 1
170.
H. Nau,
171.
J.S. Matthews et al.,
172.
L.L. Smith et al.,
173.
H.H. Varon et al., Steroids, 90, 507 ( 1 9 6 7 )
174.
M. Takeuchi, Chem. Pharm. Bull., 1 1 ( 9 ) , 1183 (1963)
175.
I.R. Sarda et al., Steroids, 1 2 ( 5 ) , 607 ( 1 9 6 8 )
176.
R.M. Scott et al., J . Chromatogr,
177.
B. Wortberg et al.,
178.
T. Taylor,
179.
S.M. Petrovic et al.,
180.
H. Jare et al.,
181.
G.W. Oertel et al., Fresenius' Z. Anal. Chem., 252(4-5),
182.
(1970)
M.,9,
331 (1962)
w.,9, 339
(1962)
44,
m.,156,205
u., 66,
6 3 3 (1969)
(1978)
177 ( 1 9 7 2 )
H., 205,
H., 134,3 5 1
223 (1981)
(1977)
306 (1970)
G. Carignan et al., Can. J. Pharm. Sci, 1 2 ( 4 ) , 1 0 6
(1977) 183.
T. Okumura et al., Bunseki Kagaku, 2 8 ( 4 ) , 235 ( 1 9 7 9 )
184.
G. Schmidt, "Steroid Analysis by HPLC," Marcel Dekker Inc., N.Y. ( 1 9 8 1 ) , pp 145-172
185.
S. Douglas, "GLC and HPLC Determination of Therapeutic Agents," Marcel Dekker Inc., N.Y. ( 1 9 7 9 ) , pp 917-935
DOUGLAS BOTH
184
186. E. Heftmann et al., J. Chromatogr, 165,283 (1979)
67,12,
187.
R.W. Roos, J. Phara. Sci.,
188.
G. Capitano et al.,
189.
R.J. Dolphin et al., J. Chromatogr,
190.
P.I. Musey et al., Steroids, 31(4), 583 (1978)
191.
R.C. Cochran et al., J. ChromatoRr, 9, 175 (1979)
192.
C.G.B. Frischkorn et al., Fresenius' 2. Anal. Chem., 300(5), 407 (1980)
193.
R.W. Roos, J. Assoc. Off. Anal. Chem., 63, l(1980)
194.
R.J. Tscherne et al., J. Chromatogr, 136,337 (1977)
195.
K. Shimada et al.,
m.,68(3),
u.,178(1),
1735 (1978) 311 (1979)
143,267
(1977)
350 (1979)
11,401 (1973) Chromatogr., 164,17
196. A.G. Butterfield, J. Chromaotg. Sci., 197.
M. Schoeneshoefer et al., J. (1979)
198.
S.
199.
Hara et al.,
u,142, 689 (1977)
H. Fukuchi et al., Yakuzaigaku, 38(2), 102 (1978), CA
90: 12364
200.
L. Erb et al., Altex chromatogram, 3(1), 7 (1979), CA 94: 187898
201.
Y. Sagara et al., Nippon Naibumpi Gakkai Zasshi, 57(7), 963 (1981)
202.
F.A. Vandenheuvel et al., J. Chromatogr., 38, 439 (1968)
203.
C.H. Yates et al., J. Chromatog. Sci.,
204.
J.C. Touchstone,
205.
R. Neher, "Steroid Chromatography," 2nd ed., Elsevier Publishing Co., NY (1964)
15,555
(1977)
u.,90, 446 (1971)
185
ESTRONE
206.
K. Kao et al., Sheng Wu Hua Hsueh Yu Sheng Wu Wu Li Chin Chan., 22, 15 (1978) CA 93:145629
207.
E. Heftmann, "Modern Methods of Steroid Analysis," Academic Press, NY (1973)
208.
J. Rayan, J. Chromatogr.,
209.
S . Gorog, "Analysis of Steroid Hormone Drugs," Elsevier Scientific Publishing Co., N.Y. (1978)
210.
F.J. Kabot et al., J. Gas Chromatog., 20, 2 1 (1964)
211.
2,53
(1976)
G. Garzo et al., Proc. Conf. Appl. Phys. Chem. 2nd,
1, 3 0 1 (1971) 212.
R. Montalvo et al., Can. J. Chem., 44(1),
213.
M. Luis, Folia Endocinol (Pisa),
214.
H. Adlercreutz et al., Trans. Meet. Int. Study Group Steroid Hormones, 2nd Rome 1965, 2 1 (1966)
215.
H.J. Van der Molen et al., Steroids, 6(2) 195 (1965)
216.
S.
16,352
100 (1966) (1963)
Hara et al., Chem. Pharm. Bull., 15(7),
1041
(1967) 217.
K.W. McKerns et al., Biochim. Biophys. Acta,
82,
198
(1964) 218.
T. Luukkainen et al.,
w.,70, 700
(1963)
219.
T. Luukkainen et al.,
u.,52, 599
(1961)
220.
W.J. Vandenheuvel et al.,
221.
W. Vogt, Fresenius'
222.
J. Zweig, et al., HRC. CC., J. High Resolut. Chromatog. Chromatogr. Commun. 30, 169 (1980)
223.
S.J. Clark et al., Steroids, 20, 535 (1963)
224.
B.S. Thomas, Methodol. Sum. Biochem.,
225.
O.P. Chereshnya et al., Sb. Nauchn. Tr. Gastov. Khromatogr., 26, 60 (1976) CA 88:85400
2.
E., 64,416
Anal. Chem.,
267,
I,
(1962) 28 (1973)
77 (1978)
DOUGLAS BOTH
186
226,
M.E. Campos et al., Rev. Clin. Esp., 150 (3-4), (1978)
227.
B.F. Maume, J. Chromatogr.,
228.
H. Gottfried, Steroids, 40, 387 (1964)
229.
H. Kern et al., HRC CC, J. High Resolut. Chromatog. Chromatogr. Commun., 20, 312 (1979)
230.
H.S.
231.
H. Wotiz, Steroids, 10(1),
232.
H.T.
233.
H.G. Kaplan, Steroids, 19(6),
234.
P. Karkhanis, J. Pharm. Sci, 59(4),
235.
K. M. McErlane et al.,
236.
G.K. Pillai et al., HRC CC, J. High Resolut. Chromatog. Chromatgr. Commun., 40, 70 (1981)
237.
R.A. Okerholm et al,, J. Anal. Biochem. 44(1),
58,
133
277 (1971)
Kroman et al., J. Chromatogr.,
2, 92
(1964)
127 (1967)
Joe et al., Chromatographia, 11(11), 6 7 1 (1978) 763 (1972) 535 (1970)
w.,66(4),
523 (1977)
1
(1971) 238.
R. Knuppen et al., J. Steroid Biochem, 11(1A),
153
(1979) 239.
G. Adessi et al., Quant. Mss Spectrom. Life Sci.,
2,
231 (1978) 240.
L. Siekmann et al., Fresenius' 2. Anal. Chem.,
252,
294 (1970)
225,
241.
M. Iwai et al., J. Chromatogr.,
242.
R. Roman et al., Can. J. Pharm. Sci., 10(1), 8 (1974)
243.
T. Cairns et al., Anal. Chem.,
244.
A. Reiffsteck, Pathol. Biol, 29(6),
95 :93401 245.
53,
G.
275 (1981)
1217 (1981) 335 (1981) CA
Mikhail et al., Acta Endocrinol. Suppl, (147),
(1970)
347
ESTR 0N E
187
=., Korenman et al., =.,
246.
A. R. Midgley et al.,
(147),
320 (1970)
247.
S.G.
(147),
291 (1970)
248.
R.C. Baxter, Clin. Chem., 26(6),
249.
G.C. Visor et al., J. Pharm Sci, 70, 5 (1981)
250.
D. Exley, Pure Appl. Chem, 52(1),
251.
J. Grenier et al., Radioimmunoassay Relat. Proced. Med., Proc. Int. Symp. 1977, 1,9 1 (1978)
252.
B.M. Jaffe, "Methods of Hormone Radioimmunoassay," 2nd ed., Academic Press, N.Y. (1979), pp 333-344
253.
R. Malvano et al., Horm. Res.,
254.
0. Axelsson et al., J. Steroid Biochem.,
763 (1980)
33 (1980)
90, 418
(1978)
9,
1119
(1978) 255.
R. DeHertogh, E., 4 , 73 (1973)
256.
M. Castanier et al.,
257.
R.W. Bordens et al., Clin. Chem., 25(7),
258.
S.
259.
P.H. Moore Jr. et al.,
260.
K. Carlstrom et al., J. Steroid Biochem.,
w.,2, 305
(1972)
Kushinsky et al., Steroids, 23(4),
M.,20(2),
1323 (1979)
535 (1974) 199 (1972)
8, 1127
(1977) 261.
M. Luisi et al., The Lancet, 2(8193),
262.
B.R. Bhavnani et al., J. Clin. Endocrinol. Metab., 52(4),
543 (1980)
741 (1981)
263.
G. Mikhail et al., Steroids, 15(3), 333 (1970)
264.
R. Paradisi et al., Acta Endocrinol., 94(2),
229
(1980) 265.
T. Ohashi et al., Acta Med Okayama, 3 3 ( 3 ) , (1979), CA 91:171156
157
DOUGLAS BOTH
188
266.
M. dem Fencl et al., Analytical Letters, 14(B5), 323 (1981)
267.
A. Belanger et al., J. Steroid Biochem., 13(2),
185
(1980) 268.
0. Axelsson et al., Acta Endocrologica, 87(3),
609
(1978) 269.
T.A. Rance. et al., J. Steroid Biochem.,
9,
1065
(1978)
89, 59 (1978) Endocrinogica, 2, 716
270.
A.M.G. Bosch, Clinica. Chimica Acta,
271.
L.E. Edqvist et al., Acta (1972)
272.
C. Wright et al., J. Clin. Endo. and Metab,
36,
165
(1973) 273.
P. Doerr, Acta. Endocrinol, 81, 655 (1976)
274.
P.F. Brenner et al., Steroids, 22(6),
275.
H.A. Robertson et al.,
276.
D.A. Shutt et al., ibid, 21(4), 565 (1973)
277.
J.C. Wingfield et al., ibid, 26(3),
278.
C. Gros et al., Ann. Biol. Clin. (Paris), 36(4), (1978), CA 90: 117439
279.
S.
=.,
20(6),
775 (1973) 651 (1972)
311 (1975)
Kono et al., Horumon To Rinsho, 27(12), CA 92:106793
393
1409
(19791, 280.
N . P . Goncharov et al., Vopr. Med. Khim, 25(1), (1979), CA 90:134705
281.
A. Lopez-Sebastian et al., Ann. Biol. Amin. Biochim. Biophys, 19(6), 1689 (1979)
282.
J. Bartos, "Colorimetric and Fluorimetric Analysis of Steroids," Academic Press, NY (1976)
283.
M. Pesez, "Colorimetric and Fluorimetric Analysis of Organic Compounds and Drugs," Marcel Dekker Inc., NY (1974)
92
189
ESTRONE
284.
F.D. Snell, "Colorimetric Methods of Analysis," Van Nostrand Reinhold Co., NY (1961)
285.
M. Gajewska et al., Chem. Anal., 20(3),
286.
M.A. DeSoto Perera, Anal. Chim. Acta, 119(2), (1980)
615 (1975) 263
ETOMIDATE Zui L. Chang and Joseph €3. Martin 1. Description I , 1 Nomenclature 1.2 Formulas and Molecular Weight 1.3 Appearance, Color, Odor 2. Physical Properties 2.1 Infrared Spectrum 2.2 Proton Magnetic Resonance Spectrum (PMR) 2.3 Mass Spectrum 2.4 Raman Spectrum 2.5 Ultraviolet Spectrum (UV) 2.6 Solubility 2.7 X-Ray Powder Diffraction 2.8 Melting Range 2.9 Differential Thermal Analysis 2.10 Specific Optical Rotation 3. Synthesis 4. Stability-Degradation 5. Method of Analysis 5.1 Identification 5.2 Elemental Analysis 5.3 Chromatographic Analysis 5.4 Titrimetry 6. Analysis of Pharmaceutical Formulations 6.1 Spectrophotometric Method 6.2 High Performance Liquid Chromatography (HPLC) 7. Drug Metabolism and Pharmacokinetics 8. Determination of Etomidate in Biological Fluids References
ANALYTICAL PROFILESOF DRUG SUBSTANCES VOLUME 12
191
192 192 192 192 192 192 194 196 198 20 1 20 1 20 1 203 203 205 205 205 208 208 209 209 210 21 1 21 1 21 1 211 212 213
Copyright hy the American Pharmaccurlcal Associatian.
ISBN 0-12-260812-7
ZUI L. CHANG AND JOSEPH B. MARTIN
192
1.
Description
1.1 Nomenclature 1.11 Chemical Name (K )- (+)e t h y l 1- (l-phenyle t h y l )-lH-imidazole-5car box y l a t e
1.12
Generic Name E t omida t e
1.2
.
Formulas and Molecular Weight
CHCH3 I
C14H16N202
1.3
M.W.
244.29
Appearance, C o l o r , Odor Etomidate is a f i n e w h i t e powder w i t h no d i s c e r n i b l e odor.
2.
Physical Properties 2.1
I n f r a r e d Spectrum The i n f r a r e d spectrum of Etomidate i s p r e s e n t e d i n Figure 1. The spectrum was measured i n t h e s o l i d s t a t e as a potassium brani.de d i s p e r s i o n . The following bands (cm'l) have been a s s i g n e d f o r F i g u r e 1 (1).
a.
3128 and 3100 cm'l
Two bands due t o t h e C-H s t r e t c h i n g v i b r a t i o n s of t h e imidazole r i n g .
9 0
e 0
t 0
9 0
0
B Y
8
0 0 0 -
s
U
U
-'s*
C I -
0
51s * E
0
8 m
0
5: m
0 0 0
094q* 0 - -
194
ZUI L. CHANG AND JOSEPH B. MARTIN
b.
3028 and 3062 cm-1
Two weak bands due t o t h e C-H s t r e t c h i n g v i b r a t i o n s of t h e benzene r i n g .
C.
Between 3000 and 2850 cm-1
Complex of weak t o medium bands due t o t h e C-H s t r e t c h i n g v i b r a t i o n s of t h e methylene and methyl g rou p s
.
2.2
d.
1700 cm-1
Strong band due t o t h e C=O s t r e t c h i n g v i b r a t i o n of t h e a,$ u n s a t u r a t e d e s t e r group.
e.
1597 and 1580 cm-1
Two week bands due t o t h e skeletal s t r e t c h i n g v i b r a t i o n s of t h e benzene r i n g .
f.
1518 cm-1
Probably due t o t h e skeleta1 stretching vibration of t h e imidazole r i n g .
g*
1205 cm-1
Strong band due t o t h e C-0 s t r e t c h i n g v i b r a t i o n s of t h e a,$ u n s a t u r a t e d ester.
h.
765 and 710 cm'l
Two bands due t o t h e C-H o u t of p l a n e bending v i b r a t i o n s of t h e monosubs t i t u t e d benzene r i n g .
P r o t o n Magnetic Resonance Spectrum (PMR) The proton magnetic resonance spectrum of e t o m i d a t e as shown i n F i g u r e 2 w a s o b t a i n e d on a Varian Ass o c i a t e s HA-100 PMR Spectrometer as a 10% w/v s o l u t i o n i n a s o l v e n t of d e u t e r a t e d chloroform. The s p e c t r a l peak assignments ( 2 ) a r e presented i n Table I.
Figure 2. Proton Magnetic Resonance Spectrum of Etomidate
ZUI L. CHANG AND JOSEPH B. MARTIN
196
Table I PMR S p e c t r a l Assignments f o r Etomidate
Proton Assignment
Chemical S h i f t (ppm) 7.74 7.78
7.1-7.4
Multiplicity Doublet
Mu1t i p l e t
N-CH-Ar
6.37
Quartet
OCH2
4.23
Quartet
1.83
Doublet
1.27
Triplet
2.3
Mass Spectrum The mass spectrum of etomidate as shown i n F i g u r e 3 was o b t a i n e d u s i n g a n Associated E l e c t r i c a l I n d u s t r i e s Model MS-902 Mass Spectrometer w i t h t h e i o n i z a t i o n e l e c t r o n beam energy of 70 eV. High r e s o l u t i o n data were compiled and t a b u l a t e d w i t h t h e a i d of a n onl i n e PDP-11 Computer. The mass spectrum assignments of t h e prominent i o n s and subsequent fragments a r e shown i n Table I1 and F i g u r e 4 (3).
AllSN3lNI 3hllVl311
8 cy
0
ul
0
In
1
198
ZUI L. CHANG AND JOSEPH B. MARTIN
T a b l e I1 High R e s o l u t i o n Mass Spectrum of Etomidate Measured Mass (m/e)
C a l c u l a t e d Mass
77.0392
7 7.0391
78.0467
78.0470
79.0545
7 9.0548
95.0242
95.0246
103.0543
103.0547
104.0621
104.0626
105.0699
105.0704
199.0884
199.0872
244.1218
244.1212
2.4
Raman Spectrum The Raman s p e c t r u m of e t o m i d a t e as shown i n F i g u r e 5 was o b t a i n e d i n t h e s o l i d s t a t e on a Cary Model 83 S p e c t r o m e t e r . The f o l l o w i n g bands (cm-l) have been a s s i g n e d f o r F i g u r e 5 (1).
a.
3135 and 3103 cm-1
Two bands due t o t h e C-H s t r e t c h i n g v i b r a t i o n s of t h e imidazole ring.
b.
3018 and 3070 cm-1
Two bands due t o t h e C-H s t r e t c h i n g v i b r a t i o n s of t h e benzene r i n g .
c.
3000 a n d 2850 cm-1
Complex of bands due t o the stretching vibrations of t h e methylene and methyl groups.
d.
1710 cm-1
S t r o n g band due t o t h e C=O s t r e t c h i n g v i b r a t i o n s of t h e a,B u n s a t u r a t e d e s t e r group.
Figure 4. Fragmentation Pathways of Etomidate
0 0 0 0
0
0 N
P
0 N
1
0
I
0 N
9
0
0
1
0
a
W
1
0 9
0
0
0 0
9
0 0
0 0
m 0 0
P 0 0
2 0 0
-cr 0 0
9 0
!i! 0 0 0 N 0 0
t
N
0 0
a N
0 0 N
0 0 9
W
0
0
#
m
0
0 2
AlISN31NI
ETOMIDATE
2.5
201
e.
1610 and 1590 cm'l
Two bands due t o t h e skeletal stretching vibrations of t h e benzene r i n g .
f.
1528 cm'l
Probably due t o t h e s k e l etal s t r e t c h i n g v i b r a t i o n s of t h e imidazole r i n g .
g.
1009 and 992 cm'l
Strong d o u b l e t c h a r a c t e r i s t i c of a m o n o s u b s t i t u t e d benzene r i n g .
U l t r a v i o l e t Spectrum (UV) When t h e UV spectrum of 0.001% s o l u t i o n of e t o m i d a t e i n i s o p r o p a n o l s o l u t i o n was scanned from 400 t o 200 nm, one maximum a t 240 nm (€= 12,200) w a s observed ( F i g u r e 6). The spectrum was o b t a i n e d w i t h a Beckman Acta V Spectrophotometer.
2.6
Solubility The f o l l o w i n g s o l u b i l i t y d a t a have been determined f o r e t o m i d a t e a t room t e m p e r a t u r e (4): Solvent Water 0.01 N H C 1 0.1N-HC~ Hexane Chloroform Methanol Ethanol I s o p r opanol Propylene Glycol Diethyl Ether Ace tone E t h y l Acetate Benzene
2.7
mg Etomidate/100 m l S o l v e n t 0.0045 0.30
Greater t h a n Greater than Greater t h a n Greater t h a n
Greater t h a n
2.09 1.29 100 100 100 90-100 100 23.8 100 90-100 90-100
X-Ray Powder D i f f r a c t i o n The x-ray powder d i f f r a c t i o n p a t t e r n of e t o m i d a t e w a s determined by v i s u a l o b s e r v a t i o n of a f i l m
0.6
0.5
0A
b z
' b
0.3
Y)
m
4
0.2
0.1
0
200
250
300 WAVELENGTH (nm)
350
Figure 6. Ultraviolet Spectrum of Etomidate
203
ETOMIDATE
o b t a i n e d w i t h a 143.2 mi Debye-Scherrer Powder Came r a (Table I V ) . An Enraf-Nonius D i f r a c t i s 601 Gene r a t o r ; 38 KV and 18 MA w i t h n i c k e l f i l t e r e d copper r a d i a t i o n ; X = 1.5418, w a s employed ( 5 ) . Table I11 X-Ray
Powder D i f f r a c t i o n P a t t e r n of Etomidate d-Spacings and I n t e n s i t i e s
d(A>*
a** do* a**
9.3 7.0 6.1 5.65 5.25 4.85 4.63 4.30 4.08 3.99 3.90 3.80 3.72 3.64 3.50 3.37 3.28 3.20 3.03
15 50 40 100 40 25 80 25 30 40 35 10 10 40 5 4 10 5 20
0
2.87 2.80 2.63 2.54 2.42 2.39 2.32 2.27 2.21 2.16 2.13 2.07 1.99 1.92 1.89 1.82 1.80B 1.74 1.71
5 20
10 3 5 3 2 2 2 2 1 2 5 4 5 2 2 2 2
*d = I n t e r p l a n a r d i s t a n c e .
**1/11 = R e l a t i v e i n t e n s i t y (based on t h e h i g h e s t i n t e n s i t y of 1 0 0 ) . 2.8
M e l t i n g Range Etomidate melts i n t h e range of 67.0 and 69.0"C.
2.9
D i f f e r e n t i a l Thermal A n a l v s i s A s h a r p endothermic peak a t 66.5"C i s i n d i c a t i v e of t h e m e l t i n g p o i n t of e t o m i d a t e ( F i g u r e 7 ) .
I
0
20
I
I
40
60
80
100
120
I
I
140
160
180
1 "C (CORRECTED FOR CHROME1 ALUMEL THERMOCOUPLES)
Figure 7. Differential Thermal Analysis C u r v e of Etomidate
200
ETOMIDATE
205
2.10
Specific Optical Rotation The o p t i c a l r o t a t i o n s of 1% etomidate i n 12 s o l v e n t s measured w i t h a sodium lamp a t 589 nm and with a mercury lamp a t 570, 546, 436 and 365 nm are summarized i n Table I V ( 4 ) . Table I V
O p t i c a l Rotations* of Etomidate i n Various S o l v e n t s a t Various Wavelengths 589 nm
578 nm
546 nm
436 m
N a H g H g H g 0.1 N HC1 c kl0’;rofo nn i so p r opanol ethanol me t hanol hexane MIK ethylacetate dime thylace t amide acetone d i e th y l e t h e r benzene
+33.61 +51.81 +64.52 +69.49 +69.44 +7 3.04 +78.85 +80* 42 +80.83
+3 5.31 +54.55 +67.77 +72.96 +72.94 +7 6.69 +82.80 +84.56 +84.98
+82.37 +84.89 +90.01
+86.52 +89.09 +94.50
+ 40.56 + 62.89 + 78.21
365 nm
Hg
+
+ 88.43 + 95.64 + 97.76 + 98.18
73.17 +117.16 +146* 9 8 +15 7.63 +15 8.2 2 +163.37 +179.43 +183.32 +185.86
+123.88 +208* 25 +2 64.64 +283.29 +284.75 +286.50 +320.69 +328.31 +337.62
+ 99.74 +102.49 +108.94
+186.87 +189.38 +201.69
+334.74 +332.57 +3 54.29
+ 84.07 + 84.23
*Mean value of 2 measurements.
3.
Synthesis Etoniidate may be s y n t h e s i z e d by t h e r e a c t i o n scheme shown i n Figure 8 ( 4 ) .
4.
Stability-Degradation Etomidate has been r e p o r t e d t o hydrolyze i n s o l u t i o n t o t h e f r e e a c i d ( 4 ) a s shown i n F i g u r e 9.
ZUI L. CHANG AND JOSEPH B. MARTIN
206
N , N-Dimethyformamide
(C2H5)3N
0 ; H - N . -
CH?-
CH3 R-(+)
II
Xylene
COOC2H5
HCOOH
t
0-7H
I
N
CH, R-(+)
Na O C 2H5
H ‘c40
I
CH2
-
COOC2H5
H C O O C 2H.j
~ ~ H - N - C HI - C O O C ~ H S
CH3
1 o// C \ H
R-(+l
Figure 8. Synthetic Pathway of Etomidate
ETOMIDATE
207
FIGURE 8 (Continued)
-N-I
CH-
I
COOC~HS
iK.*H
CH3 CH2 0 C
I
H-C-CH3 I
$ -CH3
0
H-
R-(t)
R-(t)
Etomidote
ZUI L. CHANG AND JOSEPH B. MARTIN
208
Figure 9
- Hydrolysis
q-JHt
CH 3CH 2OC
I
CHCH,
of Etomidate
y-3
HOC
I CHCH
I
e t h y l 1-( l-phenylethyl1H-imidazole-5-carboxylate (E tomida t e )
R-(+)
R- (+) 1-(1-phenylethy1)-
1H-imidazole-5-carboxylic acid (Etomidate F r e e Acid)
Under mre d r a s t i c c o n d i t i o n s of r e f l u x i n a c i d systems, t h e h y d r o l y s i s i s a c c e l e r a t e d . Almost t o t a l d e g r a d a t i o n t o o t h e r products o c c u r s i n s t r o n g base r e f l u x . I n neut r a l r e f l u x , a s w e l l as under exposure t o h e a t and l i g h t , very l i t t l e d e g r a d a t i o n ( 85 % of ox lung heparins and > 70 % of porcine maxal heprins ( 2 3 ) .
of heparin sodium (A-type) in D S ; Instrument: B r u k e r WH-360
FRIEDRICH NACHTMANN ETAL.
224
The clearly detectable signal a t 2 . 1 p p i s due to acet&do-deoxy-hexose residues by means of which the mmsal Atype heparin is characterised ( 2 5 , 2 6 ) . Unlike B-type heparin (€ran ox lung), approx. 30 per cent of A-type heparin is canposed of residues of 2-acetamido-2-deoxy~-Pglucose and && glucurOnic acid ( 2 4 ) . For further interpretation of the spect n n n , the reader should r e f e r to the literature (23-26). 2.5. 13C-NMR The spectrum (figure 2 . 5 ) was recorded a t 90.5 MHz using a B r u k e r WH-360 spectraneter. 190 mg of heparin sodium were dissolwd i n 2 ml of D20. A t a pD value of 4.9, the temperature was 7OoC when recording the spectrum. D i m , 8'= 67.8 ppn, was used f o r standardisation. The signal a t 23 p p is due to a m t h y l carbohydrate i n the Awhich is fran the 2-acetamido-2-deoxy-a-D-glumse type heparin. As regards the identification of the signals or the interpretation of the spectrum, the reader should r e f e r to the l i t e r a t u r e (24, 25, 27, 2 8 ) .
+)
we are grateful to ~ ding the spectrum.
r M.. wli, sand02
LU., f o r recor-
Figure 2.5 +)
l3C-bM3 spectrum of heparin sodium (A-type) : spectmm without decoupling B : spectnrm w i t h decoupling Instrument: Bruker -360
A
in D20
FRIEDRICH NACHTMANN ETAL.
226
2.6. Solubility According to the Merck Index, 5 % of heparin sodium is mluble in water (29). According to Martindale, The ]Extra Pharmacopoeia, 1 part of heparir5 sodium dissolves i n 2.5 parts of water (30). Saturated solutions of heparin sodium, i m l a t e d fran porcine numa, wre prepared in 4 d i f f e r e n t solvents a t 2OoC. The concentrations of t h e solutions were determined quantitatively by a coagulation mthod. The res u l t s are given i n table 2.1. Table 2.1
Solubility of heparin sodium (2OOC)
Acetone
2.7. Viscositv For polymlecular substances such as heparin sodium, there is a correlation between m l e c u l a r w i g h t and viscosity. The interdependence was examined f o r bovine heparin (31). A graphical representation of the r e s u l t s is given in figure 2.6.
The two large peaks present i n the d i f f e r e n t i a l curve suggest the p o s s i b i l i t y of two discrete species i n the unfractionated product. The detectable discontinuities in the integral d i s t r i b u t i o n curve indicate heterogeneity within a relat i v e l y circwnscrd i s t r i b u t i o n of molecular weights. The discontinuities are of the order of a tetra-saccharide.
The viscanetric t i t r a t i o n of heparin with sodium hydro-
xide and calcium hydroxide was examined by V i l l i e r s e t al. (22). The t i t r a t i o n curves are given in f i g u r e 2.7.
227
HEPARIN SODIUM
100
100
90
90
80
80
70
70
60
'
50
60 50
5
v ,40 X
40
U
?
30
30
20
20
10
10
Q
0
0 70
90
110
130
150
170
190
210
[TI x103
Figure 2.6
.Integral dispersion curve for heparin sodium iractionated with alcohol. Abscissa: i n t r i n s i c viscosity, ordinate: m l a t i v e e i g h t recovered during fractionation; published by Lasker (31).
+
For N a , the specific viscosity ( j l s p ) rises slightly as E increases fran 0 to 0.6, i.e., when the strongly acidic groups are neutralised. A t B -0.6 the carboxylic groups start to be ionised. The new electric charges produce a further extension of the already partially extended m a c m l e c u l e s . Beyond 5 = 1, the specific viscosity decreases because of the salt effect of the excess of alkaline reagent. me ca2+ viscmetric curve is canpletely different. The specific viscosity decreases Miately as a increases fran 0. This trend indicates a strong interaction that 61lows m c r m l e c u l e s to contract.
FRIEDRICH NACHTMANN ETAL.
228
w
F
5
Figure 2.7
V i s c a n e t r i c t i t r a t i o n curve of heparinic acid (TN 5 . 2 mequiv/ 1) neutralised with sodium hydroxide (-.-.-#--) and calcium hydroxide (---) a t 25OC i n salt-free w a t e r solution; published by V i l l i e r s e t al. ( 2 2 ) . Investigations rtFLde by Chung and Ellerton proved that the viscosity of heparin salts is dependent on the size and &arge of the ca ion 1 9 ) . ?hereby the following order was found: Na+
through several steps
L. Histidine
H 0CH3
Br-
Walden inversion
0
alkylation with dibenzylt ethyl malonate.
COOH3 27 CgHgCH2OOC Et-
H I
I c-
I CgHgCH2OOC
1) Reduction 2) Hydrogeration 3) Lactonigation.
Scheme 7.
w
(+) -Pilocarpine (+) -1sopilocarpine
( 4 5 : 55)
Noordam et a1 Synthesis (39-40).
PILOCARPINE
411
o r acetoacetic acid is incorporated to forn; the alkaloid as shown in scheme 8.
Pilosine, the L-hydroxy benzyl analoge of pilocarpine is a naturally occuring imidazole alkaloid. This leads to the assumption that threonine might serve as a 4-carbon unit ( 4 3 ) . The condensation of 2-0x0-butyric acid (a metabolite of threonine)with urocanic acid (metabolite of histidine) result in the biosynthesis of pilocarpine as illustrated in scheme 9. Nunes (44) studied the biosynthesis of pilocarpine by feeding Pilocarpus pennatifolius with several specifically labelled potential precursor. Only L-methionine (S-methyl 14C) showed significant incorporation in the methyl group attached to the imidazole nucleus. He assumed that pilocarpidine is biosynthesized in the roots and then transported to the leaves where nitrogen methylation occurs. 5. Metabolism The corneal metabolism of pilocarpine in pigmented rabbits have been studied by Lee et a1 (45). It was found that extensive metabolism of pilocarpine occur in the cornea of pigmented rabbit and the major metabolite, is pilocarpic acid. This finding contrasts with studies done in the albino rabbits where low level of pilocarpic acid was observed. The author also studied the low occular bioavailability ( 4 6 ) of topically applied pilocarpine which was mainly attributed to preconeal drug loss in conjunction to the resistance to corneal penetration. Among other factors e.g., drainage, lacrimation, vasodilation which influences drug loss at the absorption site. Mathematical model were formulated f o r these findings. Friedman and Patton (47) showed that, after administration of pilocarpine; 25 ml of 1 x lO-*M into the eye of the rabbits of different ages, pilocarpine concentration was higher in the aq. humor of 20 days old rabbits than the 6 0 days old rabbit. This shows that, less pilocarpine is needed to achieve the same effect in younger rabbits. 6. Methods of Analysis
6.1 Titrimetric methods --
ABDULLAH A. AL-BADR AND HASSAN Y.ABOUL-ENEIN
412
0
I/ c
CH3-
\
7
+
2
Pathway 1
HO-
'i
HO
H 1
d
Scheme 8.
Biosynthesis of pilocarpine according to Biot ( 4 2 ) .
CH3-CHZ\
HC
o = cI
c = o +
HO-
/
OH
c=c
' I Scheme 9.
\
Pathway 2
C
CH3CH2\
t-+"O--"
CNN>
=\
"0
--.CH CH20H
CN6 = NH
pilocarpine
Biosynthesis of pilocarpine according to Brochmann-Hansen and Nunes ( 4 3 ) .
1
PILOCARPINE
413
6.11 Non-Aqueous Titration: a)
Pilocarpine hydrochloride. This salt is assayed in USP XX (2) and B.P. 1980 (48) by non-aqueous titration with 0.1N perchloric acid using crystal violet in glacial acetic acid containing mercuric acetate.
b)
Pilocarpine iiitrate: This salt is assyed in USP XX (2) and B.P. 1980 (48) by non aqueous titration with 0.1N perchloric acid. The end point is determined potentiometrically.
6.12 Conductimetric titration: Jarzebinski and Suchocki (49) reported a method for determination of pilocarpine hydrochloride among other hydrochlorides of several alkaloids by direct-conductimetric titration with 0.01N or 0.005N NaOH in aqueous ethanol medium. Another conductimetric method was reported (50) for determination of pilocarpine hydrochloride in eye drops, whereby the sample was made alkaline and extracted with chloroform. The combined extracts were evaporated, the residue dissolved in aqueous ethanol and titrated conductimetrically with O.01N HCl. 6.13 Ion-Selective Electrode Crytur valenomycin ion-selective electrode was used (51) for the end point determination in the precipitation titration of pilocarpine with sodium tetraphenyl borate. 6.2
Polarographic Analysis Clark -et a1 (52) determined pilocarpine and some other related imidazole derivatives using the polarographic behaviour of the copper complexes of these compounds. In one molar citric acid, one molar sodium citrate one molar copper sulphate medium at 25'C. The E of I/ 2 the Cu++ - Cu+ citrate system is controlled by the
414
ABDULLAH A. AL-BADR AND HASSAN Y.ABOUL-ENEIN
concentration of pilocarpine o r imidazole compounds. Thus pilocarpine and related imidazoles are determined by differential pulse polarography with dropping merof the first wave was used for cury electrode. The E 1/2 the calculation. When the hanging mercury electrode was used, the peak height was proportional to pilocarpine concentration from 0.4 to 1.6 mM. 6.3 Gravimetric Analysis Pilocarpine among various alkaloids form insoluble metallic complexes with several inorganic salts such as HgC12, SbC13, Hg12 in KI, BiI3' Sb13, MnC12 in KI, U 0 2 (N03)2 and the [CO (CNS)4]-- group. Rejnecke's salt picric acid and flavianic acid also precipitate many alkaloids. These ppts can be used for the gravemetric determination of pilocarpine specially the precipitate with ilavianic acid. (53). Another method was reported by Ganescu et a1 (54) based on the formation of chromium-thiocyanate complex, with pilocarpine, whkch has the formula PHCr (SCN)4- (A)2. where P = Pilocarpine, A = Amine preferably aniline o r morpholine. This complex can be determined gravemetrically, spectrophotometrically o r by oxidation with KMn04. 6.4 Polarimetric Analysis
The content of pilocarpine and its inactive degradation products, pilocarpic acid, can be determined by a polarimetric method (55), as follows: The solution was made alkaline with aqueous ammonia, extracted with chloroform (in which pilocarpic acid interferes in the spectrophotometric procedure and is insoluble). The solution was diluted with chloroform and the specific rotation was measured. The content of pilocarpine can be determined from calibration graph.
6.5 Phase-Solubility Analysis Pilocarpine among other substances can be determined by the phase-solubility analysis (56), employing solubilityproduct relationship technique. Known and increasing weights of the samples and of picric acid are shaken together for 48 hours with fixed volume of acetate
PILOCARPINE
415
buffer solution of pH 3.9 in a series of stoppered flasks. The picrate ion concentration is determined in each supernatant liquid by measurement of the extinction at 357 nm. The concentration of the principal component in the sample can be calculated whether o r not the impurity forms picrate o r is insoluble in the buffer solution. The accuracy is comparable with that of conventional phase-solubility analysis. 6.6 Fluorescence Analysis
Pilocarpine among several drugs react with 9-bromomethylacridine in acetonitrile media (57) to give quarternary ammonium salts which on subsequent photolysis yield fluorescent products. The amine concentration-fluorescence correlation is linear and can be used for the assay of various tertiary amines (including pilocarpine) in aqueous solutions and biological fluids, for example, human blood.
6.7 Spectrophotometric Analysis 6.71 Infra-red Spectrophotometric Analysis Pilocarpine, free base o r liberated from official salts,hydrochloride and nitrate,has been determined by infra-red spectrometry (58). The calculation of pilocarpine content was measured from extinction at 9 um with correction for the base line from 8.9 to 9.3 pm and by comparison with correlated extinction of a similarly treated standard solution of pilocarpine. The method is specific and the recoveries were 99.0 to 102%. Another infra-redanalysis of pilocarpine among other drugs was also reported (59). Ryan (60) reported a sensitive and convenient method of infra-red measurement of pilocarpineisopilocarpine isomerisation. Pilocarpine base is dissolved directly o r extracted from salts in basic buffer with chloroform. After evaporatioli, the residue dissolved in CS2 and examined by
IR spectroscopy at the 3 mm cell. The ratio of extinction at 1100 cm-l and 1082 cm-l i s used to calculate the isopilocarpine content (the trans, less pharmacologically active isomer) from a
ABDULLAH A. AL-BADR AND HASSAN Y.ABOUL-ENEIN
416
standard curve (Figure9). Drug formulation excepients do not interfere (they are insoluble in CS2). However, non-polar substances that cannot be separated by prior extraction do interfere. The coefficient of variation for a 50 : 50 isomer mixture was f 1.83% (seven determination). 6.72 Ultraviolet Spectrometric Analysis
Belikov et a1 ( 6 1 ) reported a spectrophotometric analysis for pilocarpine and other imidazole derivativesand the optimum pH range required for their determination. Pilocarpine was measured at 230 nm at an optimum pH range of 4.0 to 4 . 1 9 . Another method was published ( 6 2 ) based on heating pilocarpine hydrochloride with 10% malonic acid in acetic anhydride at 8OoC for 15 minutes. After dilution with ethanol, the extinction is measured at 333 nm. The limit of dilution was reported to be 10 to 30 ng/ml. Dosage forms require preliminary extraction of the base. For pilocarpine hydrochloride, the coefficient of variation was 2 t o 6.5%. 6.73 Spectrofluorimetric Analysis
Pilocarpine among some alkaloids containing a tertiary amino groups ( 6 3 ) were determined spectrofluorometrically by converting the non-fluorescent alkaloid into fluorescent compound. This was achieved by base-catalysed condensation with the mixed anhydride of organic acid. A solution containing 10% malonic acid in acetic anhydride is heated with alkaloid at 8OoC for 1 5 minutes. The solution was then diluted to a specific volume with ethanol. A suitable aliquate ( 5 0 111) was diluted to 10-25 ml of ethanol and set aside for 10 minutes. The fluorescence produced was measured for pilocarpine HC1 at 450 nm (Extinction at 395 nm). The limit of determination of this method was reported to be 2.8 Pg/ml. 6 . 7 4 Colorimetric Analysis
Several colorimetric methods have been published on the determination of pilocarpine and its salts in various pharmaceutical preparations. The compilations of the methods are summarized in Table 2 .
Table 2 Reagent used to produce color. 1% NaOH + 1% sod. Nitroprusside, addition of 1% HC1 in water after 3 minutes. Aminone at pH 4 .
+
213 orange complex at pH 4 .
10% acetic acid, 5% P o t chromate + 3% aq. H202. Shake for 20 minutes. Extract the color produced with chloroform. Sulphuric acid
Wavelength or color produced.
bismuth Iodate.
+
0.75 M Hydroxylamine 2.4 M sod. hydroxide, heat at 40' for 5 minutes. Mix with ferric chlorate.
1 M hydroxylamine HC1 + 7% sod. sulphate + 3.5M NaOH. Set aside f o r 10 min. Add 5.25 M HC1 + 0.3 M ferric chloride in 0.1 M HC1. Set aside for 10 min.
560 nm.
1:l complex Pilocarpine B i 1 4 soluble in acetone 490 nm.
515 nm.
480 nm.
Comment.
Ref.
Calibration curve should be established.
(64)
Applied for eye drops.
(65)
Standard curve is required. Applied to eye ointment.
(66)
The color is stable for 30 minutes. Beer's law is obeyed for 10-60 dml.
-
(67)
(68)
Remove interfering substances if necessary.
(69)
(70)
contd.......
Reagent used to produce color.
Wavelength or color produced.
Comment.
Ref.
Acid form of Rosebengal, the color extracted with chloroform.
550 rim.
Excess saturated aq. lithium carbonate solution i s added to affect displacement o f pilocarpine from thesolution during the color formation and extraction of the complex.
Methyl orange, extracting the complex at pH 4.5 with chloroform.
420 nm.
Citrate buffer pH 6 . 8 t 0 . 3 % sodium aqua or aminopentacyanoferrate solution, heat at 45OC for 3 hours, cool.
520 nm.
The assay is unaffected by the anti- ( 7 2 ) oxidants, preservatives of nonalkaloid component. The method is applied to pilocarpine, physostigmine and mixture of the two alkaloids in eye drops and ointments. Calibration curve is required, the ( 7 3 ) coefficient of variation 1.8%. The color intensity is maximum at pH 5-7 and borate buffer solution can be used but not acetate OK phosphate buffer solutions.
0.6 M NaOH+O.lM sod. pentacyanonitrosylferrate, set aside for one hour in the dark, add 0.6M acetic acid (the pH should be about 7 ) . Set aside for 50 minutes.
520 nm.
P
r
m
Coeficient variation is 7.3%. Boric acid present in ophthalmic solution does not interfere.
(71)
(74)
contd.......
Reagent used to produce color. The formaldehyde produced by heating pilocarpine with benzyl peroxide is determined colorimetrically with chromotropic acid. 3% Ammonium reineckate solution
in acetone.
5 \o
Molybdophosphoric acid. The content of Movl in the ppt formed is determined colorimetrically after dissolution and reduction to molybdenium blue and excess reagent is masked with tartrate. 2,4-dinitrophenyl acetate method. This depends on catalytic action of the imidazole portion of pilocarpine on the hydrolysis 2,4dinitrophenyl acetate.
Wavelength or color produced. 545 nm.
Comment. The method is recommended where ingredients interfere in the hydroxylamine HC1 method. Eserine must be separated by TLC prior to the analysis.
Pink violet comp- The composition of the complex lex measured at has been verified. 533 nm. 750 nm.
357 nm at pH 7.45.
Can be applied to several organic bases mainly alkaloids.
Ref. (75)
(76)
(77)
The base should be extracted with (78) CHC13 (to exclude pilocarpic acid which interfere with the determination). The presence of NaCl increases the rate of hydrolysis of the reagent, peroxide, hydroxylamine and other nucleophiles do interfere with the assay. contd.....
Reagent used to produce color.
Wavelength or color produced.
Comment.
Ref.
Reaction should be standardized bv the use of a blank. Catalytic determination by 2,4dinitrophenyl acetate.
366 nm at pH 7.4
The differential acid dye method. Pot. acid phthalate buffer, pH 4 . 2 , 0.05% methyl orange solution in aqueous ethanol. The color produced extracted with chloroform.
420 nm.
The velocity of the reaction is directly proportional to pilocarpine concentration. Calibration graph should be established. The authors studied the fixed time and the fixed concentration to establish equations for constructing the calibration graph in each case. Applied to pilocarpine and other drugs. Blank solution is needed. The author claims the use of this method to assay pilocarpine in biological fluids.
(79)
(80)
PILOCARPINE
42 1
6.8 Chromatographic Analysis
6.81 Paper Chromatography Clarke (4a) described a solvent system used for the paper chromatography of pilocarpine consisting of citric acid : water ; n-butanol (4.8 gm:130 m l : 8.70 m l ) . The drug can bedetected by several agents such as bromocresol green spray or iodoplatinate spray. Sun (80) reported a method of separation of several alkaloids including pilocarpine using the Whattman paper no. F, moistened with calcium acid phosphate solution (0.375 M), eluting the paper with either sec. butanol or propanol : water (3:l) using the descending technique. Rfvalue wasreported. et a1 (81) described an analytical Niezgodzki -method for the determination of several alkaloids including pilocarpine in injections by means of cationic paper (0.3 inch thick) and measured the spot areas planimetrically. The method can detect 0.2 mg of pilocarpine HC1 with i 2.06% standard deviation. 6.82 Thin-Layer Chromatography Several methods have been published for the detection and semiquantitative determination of pilocarpine using thin-layer chromatography which are summarized in Table 3. 6.83 Gas Chromatography et a1 (86) and Dziedzic et a1 (87) reported Bayne similar methods for the determination of pilocarpine in biological fluids (aq. humour of rabbit cornea) in sub u g quantities. Both methods had derivatized pilocarpine (after extraction from the biological fluid) with heptafluorobutric anhydride. The derivatized pilocarpine was then introduced to the gas chromatogram under the following conditions:
-
a) Silanized glass column (6ft x 2mm) containing 3% OV-17 Chromosob W (100-120 mesh) at 190°, with N2 as gas carrier (25 ml/min) and 3H-electron-capture detector (86).
Table 3 Solvent system.
Absorbant.
Localizing agent.
Strong ammonia solution : methanol(1.5 : 100) Should be changed after two hours.
Silica Gel G.
Acidified iodoplatinate spray.
Chloroform : acetone : diethylamine,(5 : 4 : 1.)
Kiesel Gel GF 254
Dragendorff reagent.
Chloroform : acetone : diethylamine(5:5 :1)or Cyc1ohexane:diethylamine,(g : 1.)
Silica gel 60.
Iodoplatinate spray or Dragendorff reagent.
Butanol : anhydrous AcOH: dater,(4 : 1 : 5.)
Hydrolysed cotton wool prepared specially for this purpose + CaS04
W light.
Silufvl
Iodine or Dragendorff reagent.
Butanol : acetic acid : water(4 : 1 : 5.)
W Sheets.
Ref.
(4a)
(82)
(85)
Table 4 Column
Mobile phase.
Flow pressure
Aminex A-1 Cation exchange resin.
0.2 M-Tromethamine b u f f e r s o l u t i o n 5% s o l u t i o n of i s o p r o panol i n 0.2M T r i s b u f f e r o f pH 9 (0.4 ml/min).
200 p s i
UBondapak c18 and VBondapak CN
Borate b u f f e r s o l u t i o n pH 9.2: THF ( 7 : 3 ) .
1 ml/ min
Water : methanol (97:3) c o n t a i n i n g 5% KH2P04( pH 2 - 5 )
1.5 ml/ min.
L i ChrosorbRPCp, (10 Um).
Water : methanol (97 :3) c o n t a i n i n g 5% M,PO,, pH 2.5
1.5 m l / min
.
W at 216 nm.
D e t e c t i o n l i m i t 300 ng
5 pM Silica
Hexane-2% ammonium hydroxide i n isopropanol c70 :30
2 ml/ min
.
UV a t 220 nm.
The method can b e a p p l i e d f o r (94) r o u t i n e a n a l y s i s of p i l o c a r p i n e and i s o p i l o c a r p i n e and t h e i r degradation products i n t h e p r e s e n c e of each o t h e r i n ophthalmic s o l u t i o n . contd.....
!2 LiChrosorb (10 pm).
wc18
1)
Detector UV a t 217 nm.
W at 254 nm.
.
Differential refractometer.
Comment. S e n s i t i v i t y 0 . 1 mg of i s o pilocarpine i n the pressure of 100 mg of p i l o c a r p i n e o r v i c e v e r s a , no i n t e r f e r e n c e by p i l o c a r p i c a c i d . The method w a s a p p l i e d f o r ophthalmic p r e p a r a t i o n . P i l o c a r p i n e and i t s degradat i o n p r o d u c t s can b e separat e d i n about 30 min. w i t h d e t e c t i o n l i m i t of 6.6 pg.
Ref. (90)
(91)
(92)
(93)
Column.
Mobile Phase.
Flow Pressure.
Detector.
Comment.
Ref.
VBondapack c18 40% methanol with 0.005 M heptane sulfonic acid solution pH 3.6
1 ml/min. W 235 nm.
Applied for analysis of pilocarpine physostigmine, rubreserine, degradation products and preservatives in ophthalmic solution detection limit 0.003 ug.
VBondapack c18 1M mole sodium octane1-sulphonate in ethanol: water, (4:l).
1.6 m l / min
Detection limit less than (96) 3.8 ng in the presence of isopilocarpine. Applied for analysis in aq. humour. Derivatization by quaterization with a-bromo-4-nitrotoluene is required for analysis.
.
W 254 nm.
(95)
425
PILOCARPINE
b) A column (1.2 m x 4 mm) containing 2% OV-105 on Gas-Chrom Q (80-100mesh) at 200° with N2 as gas carriers (70 ml/min) and 3H-electron-capture detector (89). The following systmes have been employed for the analysis of pilocarpine (4a); (a) 5 feet x 4 mm internal diameter glass column containing 2.5% SE-30 on 80-100 mesh Chromosob WAW H MDS, column temperature 2250, carrier gas, nitrogen (50 ml/ min); detector, flame ionization detector. Rt value is 0.36 relative to codeine; @ ) 5 feet x 118 inch internal diameter stainless steel column containing 5% SE-30 on 60-80 mesh Chromosob W AW, column temperature 230°, carrier gas, nitrogen (30.7 ml/min), detector, flame ionisation detector, Rt value is 0.73 relative to codeine.
6.84 Ion-Exchange ChromatogJarzebinski (88) used column chromatography for the quantitative analysis of several alkaloids including pilocarpine. The solution of the alkaloid passed through a column, 14 cm x 1 cm, packed with Wofatit KPS (Zinc+2 form). The zinc+2 in the eluent was determined with 5 mM EDTA in the presence of Erichrome black T in a buffer medium at pH 10.4. Ion-exchange resin has been used for the purification of pilocarpine (89). 6.85 High-pressure Liquid Chromatography Several procedures have been published by several authors for the analysis of pilocarpine, isopilocarpine and their degradation products by HPLC technique, both in pharmaceutical dosage forms and biological fluids.Table 4 , summarise the HPLC systems used for pilocarpine analysis. 6.9 13C NMR Quantitative Analysis Neville et a1 (97) have reported a method for analysis of pilocarpine and its degradation products in ophthalmic formulation using 1% NMR spectroscopy. The method depends on the determination of the 1% NMR of the freeze-dried preparation in D20 to give a
426
ABDULLAH A. AL-BADR AND HASSAN Y. ABOUL-ENEIN
solution of about 20% concentration of pilocarpine. The spectrum was determined at 30° by the Fourier Transform technique using 2M tetramethyl ammonium bromide solution in D20 as external standard. The concentration of pilocarpine, degradation products and isopilocarpine was calculated from the internal c8 peak in the total alkaloid concentration from the integral C14 peak. The accuracy is stated to be within f 5%. 6.10Thermofractographic Analysis Stahl and Schmitt (98) reported a method of analysis for several alkaloids including pilocarpine, using the thermofractogram. The samples 5-10 mg was submitted to 9 temperature gradient in the range of 50-450° in an oven for 2 minutes; and the use of 50 mg of molecular seive 4A containing 20% water as propellant. Pilocarpine was transferred without decomposition to the TLC plate under conditions of carrier-gas distillation for further identification.
PILOCARPINE
427
REFERENCES 1.
Merck Index, An Encyclopoedia of Chemicals and Drugs, Motha Windholz et al, IX Edition, Merck and Co. Inc., Rahway, N.J., U.S.A. page 7220 (1976).
2.
United States Pharmacopoeia XX, Twentieth Edition, United States Pharmacopoeia1 Convention, Inc., page 627 (1980).
3.
S. Fregerslev and S.E. Rasmussen, Acta Chem. Scand.,22, 2541 (1968).
4a.
E.G.C. Clarke, Isolation and Identification of Drugs. The Pharmaceutical Press, London, page 500 (1969).
4b. Basic Tests for Pharmaceutical Substances, WHO, Geneva, WHO/Pharm./81.506/Rev.l, page 92 (1981). 5.
S. Riegelman and D.G. Vaughan, J . Amer. Pharm. Ass. Pract. Ed., 19, 474 (1958).
6.
C.J. Blok, Pharm. J., 155, 282 (1945).
7.
W.H. Morrison and S.M. Truhlsen, Amer J. Ophtholmol., 357 (1950).
8.
33,
R.A. Anderson and S.D. Fitz Gerald Australas. J. Pharm.,
48, s108 (1967).
2, 25 (1967).
9.
R.A. Anderson, 3.J . Pharm. Sci.,
10.
I.R. Brown, A.E. Dyer, I.N. Elowe, I.E. Stauffer and B.C. Walker, Can. J. Pharm. Sci., I,22 (1966).
11. Y.I. Zelikson, Farmatsiya, 18,23 (1969). 12. R. Fagerstorm, J. Pharm. Pharmacol.,
15,479
13. P.H. Chung, T.F. Chin and J.L. Lach, 1300 (1970).
J. Pharm.
(1963).
14. K. Baeschlin and J.C. Etter, Pharm. Acta Helv., 339 (1969). 15. E. Ermer, Pharm. Ztg:
120, 1771,
16a. A. Ben Bassat and D. Lavie,
Sci.,
2,
44,
(1975).
z. 2. Chem. 10, 385 (1972).
ABDULLAH A. AL-BADR AND HASSAN Y . ABOUL-ENEIN
428
16b. The Aldrich Library of IR Spectra, 2nd Ed., C.J. Pouchert, page 1065 (1975). 17. The Aldrich Library of NMR Spectra Vol. VIII, C.J. Pouchert, R. Campbell, page 35 (1974).
18. H.Y. Aboul-Enein, Synthesis and Pharmacological Activity of Structural and Conformational Analogs of Pilocarpine, Ph.D. Thesis. The University of Mfssissippi, July (1971). 19a. L. Simeral and G. Maciel; Org. Magn. Resonance, 5, 226 (1974). 19b. L.F. Johnson and W.C. Jankowski, Carbon-13 "R Spectra, a Colletion of Assigned, Coded and Indexed Spectra, A Wiley Interscience Publication, Spectra No. 424. 20. G.A. Neville, F.B.Hasan -*Chem 9 54, 2094 (1976).
and Ian C.P. Smith, Can. J.
m.
Biochem. 21. H.Y. Aboul-Enein and R.F. Borne, Environ. Instrumentation, Lo, 231 (1980). 22. N.A. Preobrashenski and W.A. Proeobrashenski, Ber. Deut. 68, 847 (1935). Chem.
e.
23. N.A. Preobrashensk.i,W.A. Preobrashenski, and A.M. Poljakova, Deut. Chem. Ges. 67,710 (1934).
&.
24. N.A. Preobrashenski, A.M. Poljakova, and W.A. Probrashenski, Ber. Deut. Chem. Ges. 3, 844 (1935). 25. N.A. Preobrashenski, A.M. Poljakova, and W.A. Preobrashenski, Ber. Deut. Chem. Ges. 3, 850 (1935). 26. N.A. Preobrashenski, A.F. Wompe, and W.A. Preobrashenski, Ber. Deut.Chem. Ges. 66, 1187 (1933). 27. N.A. Probrashenski, A.F. Wompe, W.A. Preobrashenski, and M.N. Schtschukina, Deut. Chem. Ges. 66, 1536 (1933).
x.
28. A.M. Poljakova, W.A. Preobrashenski, and N.A. Preobrashenski, Ber. Deut. Chem. Ges. 69, 1314 (1936). 29. N.A. Preobrashenski, A.M. Poljakova, and W.A. Preobrashenski, Deut. -Chem. - Ges. 69, 1835 (1936).
&.
429
PILOCARPINE
30. M.M. Katsnel'son, A.M. Pojakova, N.A. Probrashenski, and W.A. Preobrashenski, Pilocarpine and its homologs, Russ., 47.693, July 31, 1936, C.A. 33, 3400 (1931). 31. N.A. Preobrashenski, M.E. Maurit, and C.V. Smirnova, Dokl. Akad. Nauk. -SSSR 81, 613 (1951). 32. A.N. Dey, J. Chem. S O ~ .1057 (1937). 33.
A.V. Chumachenko, M.E. Maurit, A.D. Treboganov, G.V. Smirnova, R.B. Teplinskaya, L.V. Vokova, E.N. Zvonkova, and N.A. Preobrashenski, Dolk. Akad. Nauk. SSSR 178, 182, (1968).
34.
A.V. Chumachenko, E.N. Zvonkova, and N.A. Preobrashenski, Zh. Org. Khim. USSR 5, 571 (1969). -
3%.
A.V. Chumachenko, E.N. Zvonkova, and R.P. Evstigneeva, Khim, USSR 8, 1112 (1972).
Zh. Org.
35b. A.V. Chumachenko, E.N. Zvonkova and R.P. Evstigneeva, Zh. Org. Khim. USSR 8, 1100 (1972). 36. J . I . DeGraw, Tetrahedron 28, 967 (1972). 37. J.I. DeGraw, J.S. Engstrom, and E. Willis, J. Pharm. Sci. 64, 1700 (1975). 38. H. Link and K. Bernauer, Helv. Chim. Acta 55, 1053 (1972). 39. A. Noordam, L. Maat and H.C. Beyerman. Recl. Trav. Chem., Bays-Bas, 98, 467 (1979). 40.
A. Noordam, L. Maat and H.C. Beyerman, Recl. Trav.,
Bays-Bas, 100, 441 (1981).
m.
41. H.Y. Aboul-Enein and A.A. Al-Badr, Methods and Findings, in Exptl. Clin. Pharmacol., 4(5), 321 (1982). 42. H.G. Biot, Ergebnisse der Alkaloid-Chemie bis (1960), Berlin 750 (1961). 43. E. Brochmann-Hansen, M.A. Nunes and C.K. Olah, Planta Medica, - 28, 1 (1975).
44. M.A. Nunes, Pilocarpine: Studies on its Biosynthesis and
-in vitro
Degradation, Ph.D. Thesis, San Francisco (1974).
ABDULLAH A . AL-BADR AND HASSAN Y . ABOUL-ENEIN
430
45. V.H. Lee, H. Hui and J.R. Robinson, Invest. Ophtholmol. Visual Sci., 2, 210 (1980). --
46. V.H. Lee and J.R Robinson, 2. Pharm. Sci.,
68,
47. T.S. Friedman.and T.F. Patton, 2. Pharm. Sci., (1976).
673 (1979).
65,
1095
48. British Pharmacopoeia, Her Majesty's Stationery Office, London, p. 351 (1980). 49. J. Jarzebinski and P. Suchocki, Farm. pol., 33, 151 (1977). 50. P. Hanna, Farmacja pol.,
31, 123
(1975).
51. K. Vytras, V. Riha, Cesk. Farm., 26, 9 (1977). 52. G.C.F. Clark, G.J. Moody and J.D.R. Thomas, Anal. Chim. -*, Acta 98, 215 (1978). 53. H. Wachsmuth, J. Pharm. Belg., 8, 1 and 76 (1953). 54. I. Ganescu, C. Varhelyi and G. Brinzan, Arch. Pharm., Weinheim, 309, 887 (1976). 55. J . B . Murray, Proc. SOC. Analyt. Chem.,
7, 107 (1970).
56. A.J. Repta and P. Bansal, 2. Pharm. Sci., 57. R.E. Lehr and P.N. Kaul, 2. Pharm. Sci.,
@. Off.
Analyt. Chem.,
1069 (1972).
64,950
58. W.H. Washburn, her. Pharm. Ass. Sci Ed., 59. J.I. Roberts, J.
61,
(1975).
42,
698 (1953).
50,
658 (1967).
60. J. Ryan, Anal. Chim. Acta, 85, 89 (1976). 61. V.G. Belikov, E.V. Kampantseva and E.N. Vergeichik, Farmatsiya 25, 41 (1976).
s,
62. A.D. Thomas, J. Pharm. Sci., 28, 838 (1976). 63. A.D. Thomas, Talanta, 22, 865 (1975).
64. V.G. Belikov and V.N. Bernsntein, U.S.S.R. Pat. 141, 871, through Anal. Abstr. 10,781 (1963). 65. V.V. Petrenko and S.S. Artemchenko, Farmatsevt &. Kiev, 31, 63 (1976).
PILOCARPINE
431
66. G. Wieslawa, Farmacja
x., 26, 1023 (1970).
67. A. Kessler, J. Krzek and E. Czurlowska, Farm. P o l . 34, 585, (1978).
68. R.E. Natori and T. Baker, 2. Pharm. Sci., 69. I.S. Gibbs and M.T. Murray, J. Pharm. (1970). 70.
61,
244 (1972).
s., 2, 395
E. Brochmann-Hansen, P. Schmid and J.D. Benmaman
Sci.,
54,
783 (1965).
71. P. Laugel and M. Hasselmann, Chem. Anal.
44.
2. Pharm.
433 (1962).
72. Y.A. Mohamed and M.A. El-Sayed, Pharmazie, 30, 60 (1975). 73. V. Karas-Gasparec, S . Zalta and V. Ondrusek, Acta Pharm. Jugosl., 22, 1 (1972). 74. M.S. Karawya and M.G. Ghourab, 2. 55, 1180 (1972).
Ass.
75. G. Teodorescu, Revue roum. Chim.,
19,1645
Off Analyt Chem.
(1974).
76. J. Celechovsky and D. Svobodova, Ceskosl. Farm. 380 (1959). 77. A. Repta and T. Higuchi, J. Pharm.
8,
x., 60, 1465 (1971).
78. T. Beyrich and G. Krugmann, Pharmazie, 35, 21 (1980). 79. M.A. El-Sayed and J.C. Ike, Pharmazie, 33, 612 (1978). 80. Y.T.
Sun, J. Taiwan Pharm. A s s . ,
5,
17 (1954).
81. L. Niezgodzkz, W. Manikowski and J. Orlowski, Farmacja Pol.23, 581 (1967). 82. S. Ebel, W.D. Mikulla and K.H. Weisel, Dt Apoth Ztg. , & l 931 (1971). 83. E. Merat and J. Vogel, Mitt. Geb. Lebensmittelunters 70, 283 (1979).
84. E.A. Tukalo, S.I. Massarskii and L.A. Kopylov., Sb. Nauch.Trud. Vitebsk. 11,191 (1964).
&. w.,
a.,
ABDULLAH A. AL-BADR AND HASSAN Y. ABOUL-ENEIN
432
85. H. Weiss and Szameitat, Pharm. Prax. Berl., (2), 31 (1974); through Anal. Abstr. 27, 2164 (1974).
86. W.F. Bayne, L.C. Chu and F.T. Tao, J. Pharm. Sci., 1724 (1976). 87.
65,
S.W. Dziedzic, S.E. Gitlow and D.L. Krohn, J. Pharm. Sci. 65, 1262 (1976).
88. J.J. Jarzebinski,
&.
Pol. Pharm.,
33, 493
(1976).
89. E.S. Vysotskaya, Yu. V. Shostenko and S . Kh. Mushinskoya, Voronezh. Gos. Univ., 72, 220 (1969); through C.A. 156309h (1972).
z.,
z,
90. T. Urbanyi, A. Piedmont, E. Willis and G. Manning, J. Pharm., 65, 257 (1976).
x.,
91. S.K.W. Khalil, 2. Pharm. Sci., 66, 1625 (1977). 92. A. Noordam, K. Waliszewski, C. Olieman L. Maat and H.C. Beyerman, 2. Chromatogr., 153,271 (1978). 93. J.J. O'Donnell, R.Sandman and M.V. Drake, J. Pharm. Sci. 69, 1096 (1980). 94. D.L. Dunn, B.S. Scott and E.D. Dorsey, J. Pharm. 70, 446 (1981).
g.
95. M. Kneczke, J . Chromatogr., 198,529 (1980). 96. A.K. Mitra, C.L. Baustian and T.J. Mikkelson, 2. Pharm. Sci., 69, 257 (1980). 97. G.A. Neville, F.B. Hasan and I.C.P. Smith, J. Pharm. Sci. 66, 638 (1977).
98. E. Stahl and W. Schmitt, Aroch. Pharm. Weinheim, 308, 570 (1975). Acknowledgement The authors wish to thank Mr. Altaf Hussain Naqvi for typing the manuscript and School of Pharmacy, University of Mississippi, University, Mississippi, U.S.A. for determining the mass spectrum of pilocarpine.
PYRAZINAMIDE Ernst Felder and Davide Pitre 1. Foreword, History and Therapeutic Category
2. Description 2.1 Nomenclature 2.2 Formula, Molecular Weight 2.3 Appearance, Color, Odor and Taste 3. Physical Properties
3.1 Spectra 3.2 Physical Properties of Solid State 3.3 Solubility 3.4 Partition Coefficient 4. Metal Complex Salts 5. Synthesis and Manufacturing 6. Stability 7. Metabolism and Pharmacokinetics 7.1 Metabolism 7.2 Pharmacokinetics 7.3 Protein Binding 7.4 Acute Toxicity 8. MicrobiologicalAssay 8.1 Biological Method for Pyrazinamide Determination 9. Methods of Analysis 9.1 Elemental 9.2 Identification Tests 9.3 Official Methods 9.4 Nonaqueous Titrimetric Analysis 9.5 Colorimetry 9.6 Ultraviolet SpectrophotometricMethod 9.7 ComplexometricAnalysis 9.8 Chromatography 9.9 Counter Current Distribution 9.10 Polarography 10. Determination of Pyrazinamide in Body Fluids and Tissues References
ANALYTICAL PROFILES OF DRUG SUBSTANCES VOLUME 12
433
434 434 434 435 435 435 435 442 445 441 441 448 450 450 450 45 1 452 452 452 452 453 453 453 453 453 453 454 454 454 456 456 457 458
Copyright by the American Pharmaceutical Associalinn. ISBN 0-12-260812-7
ERNST FELDER AND DAVIDE PITRE
434
Foreword, History and Therapeutic Category Pyrazinamide is together with Isoniazid and Rifampicin a key drug in the short-course chemotherapy o f pulmonary tuberculosis and is included in several multidrug regimens recommended by the IUAT and WHO (192).
In 1936 flalmer and Walter (3) first described Pyrazinamide together with N-a1 kylsubstituted Pyrazinamides that were reported to be useful as analeptics. Only in 1952 Kuschner et a1.(4) and Malone (5), starting from the observation that Nicotinamide showed some antitubercular activity, recognized the antitubercular activity of the isosteric Pyrazinamide in experimental mouse tuberculosis. Subsequently it was found to be clinically active in humans (Minutes of the llthe Conf. on Chemoth. o f Tuberc.). The drug was Introduced in primary chemotherapy of tuberculosis in the early 1950's. Whereas toxicity was a major problem with high daily dosages given for long periods this was not the case with moderate daily dosage. In the last decade the introduction o f short-course chemotherapy of tuberculosis, based on the experimental work in mice (6,7,8) has fully revaluated Pyrazinamide. Pyrazinamide containing regimens produce a high rate culture negativation at two months and a low incidence of bacteriological relapses after stopping chemotherapy (9,10,11,12,13). 2.
Description
2.1
Nomenclature
2.1.1
Chemical names Pyrazinecarboxamide; Pyrazine-2-carboxamide CAS: 98-96-4
2.1.2
Generic Name Pyrazi namide
2.1.3
Trade names Aldinamid; Eprazin Piraldina Pirilene Pyrafat Tebrazid Tisamid
Zinamid (Merck, Sharp & Dohme) (Krugman) (Bracco) (Lepetit, France) (Saarstickstoff-Falot) (Continental Pharma) (Orion)
435
PYRAZINAMIDE
2.2
Formula, Molecular weight
C5H5N30
Mol. w t . = 123.11
Wiswesser l i n e notation: T6N DNJ BVZ 2.3
Appearence, color, odor and t a s t e
White o r almost white, c r y s t a l l i n e powder; odorless o r a l most odorless (14) o f s l i g h t l y b i t t e r t a s t e (15,16). 3.
Physical Properties
3.1
Spectra
3.1.1
I n f r a r e d Spectrum
The i n f r a r e d spectrum o f Pyrazinamide Bracco Reference Standard i s shown i n f i g . 1. The spectrum was obtained as a 0.3% dispersion o f Pyrazinamide i n KBr w i t h a mod. 257 Perkin-Elmer spectrophotometer. The wave numbers and the assignments o f the p r i n c i p a l absorption bands o f the spectrum f i g . 1 are given i n t a b l e I. (19) Table I Wave number (cm-’)
assignment
3425, 3290, 3160 1716 1614 1585, 1528 1382 1183-782
J NH UC=O (Amide I) sNH+VCN (Amide 11) vC=C and YC=N (py r i n g ) v i b r a t i o n o f py ring, 6CH out o f plane, NH2 rock
The r e l a t i o n between nitrogen-hydrogen s t r e t c h i n g frequencies and N... 0 distances o f c r y s t a l s containing NH... 0 hydrogen- ands was i n assigiven (20). Usefulness o f the v i b r a t i o n a t 1000 1050 an gnment o f the p o s i t i o n o f mono and d i substituted pyrazines was r e p o r t t e d (21). The differences i n spectral features o f d . 6 , v a n d b f o r m s o f pyrazinamide was correlated w i t h differences i n c r y s t a l structures (17 ,la).
-
-
7
W
iot
Fig. 1 - Infrared Spectrum of Pyrazinamide ( K B r pellet).
PYRAZINAMIDE
437
3.1.2
Nuclear Magnetic Resonance Spectra
3.1.2.1
'H
NMR
Several authors (22,23,24,25,26) o f pyrazi ne d e r i v a t i v e s
.
1 r e p o r t about the H-NMR spectra
I n f i g . 2 t h e proton NMR spectrum o f Pyrazinamide, obtained i n DMSD sol u t i o n w i t h a Varian XLlOO spectrometer operating a t 100 MHz, i s given
(27)* The i n t e r p r e t a t i o n o f the spectrum i s given i n t a b l e 2. Table 2 Chemical s h i f t bH (PPm) TMS
Mu1t i p 1 i c i t y
9.21 8.85 8.71
doublet doublet quartet
8.25 and 7.88 3.4 2.5 0.00
Intensity
Assignment
1H
H-3 (53.5 1.5Hz) H-6 ( 5 5 . 6 ~2.4Hz) H-5 (55.6 * 2.4Hz) (53.5 C 1.5Hz) -CONH2 water DMSO TMS
1H
1H
singlets, broad
2H
-
The signals a t 8.25 and 7.88 ppm disappear a f t e r exchange w i t h D20. 3.1.2.2
"C-NMR
The 13C-NMR spectrum shown i n f i g . 3 was obtained i n DMSO solut i o n w i t h a Varian XL-100 spectrometer operating a t 25.2 MHz (28). The i n t e r p r e t a t i o n o f the spectrum i s given i n t a b l e 3. Table 3
Sc (Ppm) TMS 165.0 147.3 145.0 143.6 143.2 40
0.0
Line -
Intensity
1
40 129 35 99 107
2 3 4 5 6-12 13
-
Assignment c=o C-6 c-2 c-3 c-5 DMSO TMS
The assignments o f t h e three carbons C-3, C-4, C-5 are made on the basis o f s e l e c t i v e decoupling. The 13C-NMR spectrum o f Pyrazinamide i s n o t reported i n l i t e r a t u r e .
438
Fig. 3 - 13C-NMR (25.2.
MHz) Spectrum of Pyrazinamide in DMSO-d6.
ERNST FELDER AND DAVIDE PITRB
440 3.1.3
Mass spectrum
The mass spectrum o f pyrazinamide was obtained w i t h a s i n g l e focus spectrometer Hitachi mod. RMU-60 (70eV, 80 uA) w i t h source a t 250". The sample was i n s e r t e d a t 180" w i t h a g l i s s i n l e t system (29). The mass spectrum i s presented i n f i g . 4 The fragmentation pathways are as follows: CONH~+ (CH~NO)+ m/e 44( 23%)
T (C5 H5 N5
O)+
Mt m/e 123 (96%)
I
m/e 80 (100%)
-HCN
m/e 53 (70%)
m/e 79 (25%) . .
1
-HCN
m/e 52 (48%)
The spectrum indicates the presence of metastable ions a t m/e" 35.1
(532) and m/en 80
52
(d) 123
Fig. 4 - Low Resolution Mass Spectrum of Pyrazinamide.
ERNST FELDER AND DAVIDE PITRE
442
3.1.4
UV Spectra
The UV spectrum o f pyrazinamide was determined in water, methanol, chloroform, dilute acid and dilute alkali, with a Cary mod. 219 spectrophotometer (30). The UV spectrum of Pyrazinamide in water is presented in fig. 5. The molar absorptivities and corresponding wavelenghts are given in table 4.
Solvent
2 max
(nm)
E (max)
2 min
(nm)
g min
Water (n=5)
209 269 31 0
8765 2 22 8036 2 20 611 2 10
238.5 294
2000 480
Methanol
269 320
7900 530
235 296.5
1600 280
Chloroform
322
530
269 298
7500 250
0.1N NaOH
268.5 310
7950 640
238.5 295
1500 540
0.1N HCl
209 269 310.5
8000 8200 620
238.5 295
2000 51 0
These values agree with published data (31,32) 3.2
Physical Properties of the Solid State
3.2.1
Crystal Morphology
Pyrazinamide may occur in four polymorphic forms (33) namely: d Pyrazinamide, obtained from ethanol at room temperature (33) or from hydroalcoholic solution (34).$P razinamide, from ethanol at ;'0 8 Pyrazinamide, by fusion (33) and Pyrazinamide, from pouring a solution in nitromethane at 80'-140" into tetrachloromethane at room temperature (33) or from a mixture of hexane-ethyl alcohol (34,35).
i
Crystallographic data of these forms are listed in table 5.
Fig. 5 - U l t r a v i o l e t Spectrum of Pyrazinamide in Water.
444
ERNST FELDER AND DAVIDE PITRE
Table 5 Crystal lographic Data
Letter
Form
Form
6
06
Form
Form
b
'd
188'
188-193
187-189
185-1 89
23.07
10.70
10.84
5.728
6.63
3.73
3.75
5.221
3.73
14.38
7.20
9.948
101 .o
101.7
106.9
97.27
567.5
561.9
280.0
279.58
5 P21/a-C2h
Pz1/a
Pa
pi
4
4
2
2
1.44
1.45
1.46
1.46
1.44
1.45
1.46
1.46
(2)
(4)
(11
(3)
The c r y s t a l structure ofd-Pyrazinamide (34) shows a planar pyrazine r i n g w i t h distances o f C-H 1.348 A and C-C = 1.383 A. The carboxamide group forms an angle of about 5' w i t h respect t o the nucleus. 6-Pyrazinamide has a planar structure o f the nucleus w i t h the carboThe product e x i s t s as a dimer by hydroxamide group deviated 2.3'. gen bonding between the carboxamide groups. The c r y s t a l l i n e structure o f \I-Pyrazinamide and also been reported (35). 3.2.2
&
-Pyrazinamide has
X-Ray Powder D i f f r a c t i o n
The X-ray powder d i f f r a c t i o n p a t t e r n o f Pyrazinamide Bracco (Reference Standard), was determined by a P h i l i p s Powder Diffractometer w i t h n i c k e l - f i l t e r e d copper r a d i a t i o n (36).
- ....................... Instrumental conditions TUBE: Cu 50 KV, 30 mA; FILTER Ni;3SLITS lo-0.1-lo; DETECTOR Proportional t Discriminator; SCALE 1 x 10 cps; SCANNING SPEED 1/4O 20 X min; PAPER SPEED 300 mm/h; TIME CONSTANT 2 sec.; SPECIMEN HOLDER: Niskanen + I n t e r n a l Standard.
445
PYRAZINAMIDE
Table 6
I/I, xlOOxx 80 17 53 82 100 7 9 13 40 12 65 30 6
11.20 6.42 5.76 5.64 5.01 4.32 3.76 3.65 3.37 3.28 3.25 3.21 3.07
3.02 2.89 2.83 2.79 2.51 2.43 2.35 2.26 2.16 2.14
3 3 4 4 16 3 4 15 2 3
plus other l i n e s
x i n t e r p l a n a r distances = nA / 2 s i n 8
1
= 1.54051 A
xx Relative i n t e n s i t y based on highest i n t e n s i t y o f 100 3.2.3
M e l t i n g Point
UPS XX (14) and B r i t . Ph. 1980 (16) r e p o r t a melting p o i n t o f 188-189°C. 3.2.4
The e u t e c t i c mp. w i t h Benzamide (33) i s 141'C.
D.T.A.
The d i f f e r e n t i a l thermal analysis curves were recorded on a M e t t l e r TA 2000 thermal analyzer a t a heating r a t e o f 5°C per minute (39). The thermogram thus obtained, presented i n f i g . 6, shows an endotherm of the s o l i d - s o l i d type a t 146' (AH = 1600 J/mole) and a second endotherm a t 188.1' ( A H = 25900 J/mole) i n d i c a t i n g melting o f the substance. On cooling, an exotherm of c r y s t a l l i z a t i o n i s observed a t 178°C. A second thermal analysis on the same sample shows a s i n g l e melting endotherm a t 188.1"C. 3.3
Solubi 1i t y Homogeneous s o l u b i l i t y data are l i s t e d i n t a b l e 7 (37).
I I
!
Fig. 6 - DTA Curve of Pyrazinamide.
447
PYRAZINAMIDE
Table 7 Solubility of Pyrazinamide ir, g/lOO g o f solution
T =O°C
Sol vent Water Methyl alcohol Ethyl I' n- Propy 1 'I n-Butyl I' Methyl acetate Ethyl 'I n - Propyl I' n-Butyl I' Chloroform
0.64 0.84 0.29 0.19 0.14 0.59 0.31 0.23 0.14 0.28 0.0004
I sobutane
3.4
T = 38OC
I
2.65 1.63 0.74 0.65 0.65 1.18 0.70
0.40
Partition coefficient
The partition coefficients i n n-butanol/water and n-octanol/ water have been determined at 3OOC.
4.
n-butanol/water
1:l
n-octanol/water
1:0.2
-
P = 1.05 5 0.01 P = 0.330 0.003 (38)
-
Metal Complex Salts Various complex salts of Pyrazinamide with multivalent metals
have been prepared and are listed in table 8. Table 8 (C6H5N30)2
M = CO M = Co M = co M Co M = co M = CO M = CO M = Cu
x
= 2c1
X = 26r
x x
= 21 = 2C1O4
X = 2N03 H20 X = 2SCN
x x
=
so4
= 2C1O4
ERNST FELDER AND DAVIDE PIT&
X = 2CH3CO0 X = 2N03 X = ZCH3CO0
(47)
x = so4 x = 2c1 x = 2c1
(52)
X = ZCH3CO0 X = 2CH3CO0
(47)
x
= 2c1
(40)
X = 2Br x = 21
(40)
M = Ni
x
M = Ni M = Zn
X = 2SCN
(40) (40)
x
(45)
M = CU M = Hg
M = Hg M = Fe M = Pd M = Pt
M = Mn
M = Ni M = Ni M = Ni M = Ni
(48)
(47) (49)
(49) (47)
(40)
= 2C1O4 = 2c1
Under different experimental conditions adducts of the type M X4 (C H N30) and M X (C6H5N30) -where M = Ti, Zr, Sn X = C1, Br- (50) an$ fe (C H N 07 Sd H20 (5?) were also obtained. Some physical properties $o$t of ?hese complexes, as visible and IR spectra, or X-ray structural analysis, magnetic moment, vibrational spectra, etc. were given (40,41,42,43,44,45,46,47,48,49,50,51)
OF
.
.
5.
Synthesis and Manufacturing
In 1936 Dalmer and Walter (30) first described Pyrazinamide together with N-a1 kylsubstituted Pyrazinamides that were reported to be useful as analeptics. The compounds were prepared by standard methods for the preparation of acid amides, preferably by reaction of the acid chloride or of a lower alkylester of the acid with ammonia. The basic method of Pyrazinamide manufacturing is shown in fi9. 7 (53,54) Pyrazine-2,3-dicarboxylic acid I1 can be prepared by potassium permanganate oxidation of quinoxaline I (56) and converted to the anhydride V I (57) with the method of Gabriel and Sonn. Refluxing of the anhydride V I with methanol yields pyrazine-2,3-dicarboxylic acid monomethyl ester which is decarboxylated to methylpyrazinoate IV and converted without previous isolation to Pyrazinamide. A1 ternatively pyrazine-2.3-dicarboxylic acid (11) is decarboxylated to pyrazine-2-carboxylic acid (111) esterified with methanol and the so obtained methylpyrarinoate (IV) purified by distillation under reduced pressure.
A
11
0 =
0
+
5 u
z
111
CL
II-
v
N
v)
ma= II
I
p : p :
u I
N N T
I
Z
N
S
Z
u- u
I
I1
0
-T
V
L
m
I 0
N
I
z 0
I 0 0
u
E
O
u-u-u
O
w n
ERNST FELDER AND DAVIDE PITRE
450
pyrazinoic acid 111, the key intermediate, can also be prepared by condensation of 2,3-diaminopropionic acid VII with glyoxal, followed by oxidation with air (59). Oxidation of methylpyrazine VIIIa with selenious acid in pyridine or of ethylpyrazine VIIIb with potassium permanganate are further alternatives for preparation of I11 (60). Ammonoxidation of methylpyrazine VIIIa yields 2-cyanpyrazine IX (61), which is easily converted to Pyrazinamide (62). Stabi 1 i ty
6.
Pyrazinamide exhibits good stability in the solid state. There is no apparent degradation of bulk sample, either in wet or in dry atmosphere. Pyrazinamide is also stable when exposed to natural daylight (63).
7.
Metabol ism and Pharmacokineti cs
7.1
Metabol i sm
The metabolism of Pyrazinamide has been studied in humans, (64,65,67), dogs and rhesus monkeys (65,66)
.
Pyrazine-2-carboxylic acid (11) and 5-Hydroxy-pyrazine-2-carboxyl acid have been reported as the most important metabolites.
ic
In human urine two other metabolites are also excreted in minor quantities; one of them was "tentatively assigned" as pyrazinuric acid (66). The following table outlines the metabolism scheme and the related enzymes Table 9 /N
Pyrazinamide deamidase
___, Xantine
I
Oxidase
Glyci ne conjugation
+
Tentatively assigned
451
PYRAZINAMIDE
The in vitro biotransformation o f Pyrazinamide (68) in rat liver homogenate allowed the identification o f the amide of 5-hydroxypyrazine-2-carboxylic acid. This metabolite is formed in the "cytosol fraction" through xantine oxidase and is an alternative to the above scheme. A Pyrazinamide deamidase was demonstrated in the tissues of mouse, rat, pig and rabbit. This enzyme is mainly localized in the microsomes (69).
7.2
Pharmacokinetics
Pyrazinamide, administered orally, is well absorbed in the gastro-intestinal tract (70,64). Serum and urine concentrations o f Pyrazinamide and its metabolites after oral administration have been determined using the methods listed i n paragraph 10. Results obtained vary according to the methods. They can, however, be summarized as follows: in the blood high concentrations of Pyrazinamide are present, but pyrazinoic acid and 5-hydroxy-pyrazinoic acid can also be detected, while in urine little Pyrazinamide i s excreted, but pyrazinoic acid and 5-hydroxy-pyrazinoic acid concentrations are several times those of unchanged Pyrazinamide. The latter, filtered by the kidneys, is reabsorbed, while pyrazinoic acid is not reabsorbed. Peak blood levels obtained by different authors using different methods are reported in table 10. Table 10
Dose
Hours after Concentration administration (g/ml)x (%) 45
1 g
2
1 g
1 - 3
1.5 g
2
50
-
60
32
Note 15 y/ml after 15 h 30-40 /ml after 12 h half life
Reference 70
71 64
9-10 h
3 g 3 9 20 mg/kg
2 1 - 2 1 - 4
25 mg/kg 35 mg/kg
1
-
2
-
3
65 134-125 65 47 40 - 80
-
-
5-20 x/ml after 12 h
-
half life 9 h
64 67 72
75 74
ERNST FELDER AND DAVIDE PITRk
452
The cumulative u r i n a r y excretion reaches o n l y 40% i n 24 hours o f the administered dose and no Pyrazinamide can be detected i n aqueous acetone extracts o f feces c o l l e c t e d a f t e r o r a l administration. 7.3
Protein b i n d i n g
No binding o f Pyrazinamide t o plasma proteins was observed i n humans, r a b b i t s and dogs, w i t h t h e e q u i l i b r i u m d i a l y s i s method (75). 7.4
Acute t o x i c i t y The acute t o x i c i t y (DL50) o f Pyrazinamide was found t o be: i n the mouse i n the r a t
2500 mg/kg i.p. and 2730 mg/kg p.0. 2350 rng/kg i . v . and 3800 mg/kg p.0.
(76)
8.
M i crobi o l ogical Assay
8.1
B i o l ogi c a l Method f o r Pyrazi namide Determination
A b i o l o g i c a l method f o r the assay o f Pyrazinamide i n body f l u i d s (serum, blood, urine) has been developed (72). A f t e r p r e c i p i t a t i o n and removal o f proteins the pH o f the f l u i d was adjusted t o pH 5.5. The medium f o r t e s t i n g was made according t o the F i t z simons formula o f the Middlebrook 7H10 agar, changing the r a t i o o f the b u f f e r i n g phosphate s a l t s i n order t o adjust the pH t o 5.5. The surface o f the agar s l a n t was inoculated w i t h a 7H9 broth c u l t u r e o f a Pyrazinamide susceptible s t r a i n o f M. tuberculosis, which was r e s i s t a n t t o streptomycin and isoniazid. Deproteinized t e s t f l u i d (0.5 m l ) was added t o the bottom o f the inoculated tube and the tubes incubated a t 37OC f o r two t o three weeks i n an u p r i g h t position.
-
A Pyrazinamide content o f 20 t o 60 mcg per 0.5 m l o f body f l u i d r e s u l t e d i n an i n h i b i t i o n o f mycobacterial growt due t o v e r t i c a l d i f f u s i o n o f the drug. The acid pH o f the medium i s a deterrent t o a precise q u a n t i t a t i v e determination by t h i s test. The b i o l o g i c a l t e s t may however serve as a qua1i t a t i v e control on the antimycobacterial a c t i v i t y o f Pyrazinamide as determined by the chemical methods.
453
PYRAZINAMIDE
9.
Methods of Analysis
9.1
Elemental The elemental composition of Pyrazinamide is: Element % Theoretical 48.78 4.09 34.14 12.99
9.2
Identification Tests
Compendia1 identification tests involve comparing either IR or UV absorption of Pyrazinamide with its reference standard (14.16). The identification reactions reported are: a)
Perception of ammonia smell from a boiling solution of 20 mg of Pyrazinamide in 5 ml of 5N NaOH.
b)
Development of an orange-red color upon dissolution of 0.1 g of Pyrazinamide in 10 ml of H20, and addition of 1 ml of FeSO TS. The color changes to blue on addition of 1 ml o f NaOH TS; (f5).
9.3
Offi ci a1 Methods
These methods are based on the alkaline hydrolysis of Pyrazinamide and titration of the liberated ammonia (14,16). 9.4
Non-aqueous Ti trimetric Analysis
Pyrazinamide can be titrated in glacial acetic acid containing mercuric acetate, with percloric acid in glacial acetic acid as titrant. The ti tration can be carried out potentiometrically (77). 9.5 ed :
Col or i me try Colorimetric methods for Pyrazinamide determination are report-
a)
hydrolysis by dilute alkali to pyrazinoic acid, which is quantitatively determined by the orange-red color developed with ferrous ammonium sulfate (78).
b)
reaction with a1 kaline nitroprusside (nitropentacyanoferroate) to give a red-orange color with an absorption maximum at 490-500 nm (64,70). For separate determination of both pyrazinamide and Pyrazinoic acid a preliminary differential solvent extraction (i .e. benzene-n-butanol ) is described (64).
ERNST FELDER AND DAVIDE PITRE
454
c)
9.6
For determination, also i n presence o f pyrazinemonocarboxyl i c acid, n i c o t i n i c acid, i t s amide, etc., a s o l u t i o n o f the drug i s mixed w i t h 0.5 M CoC12, glycerol and 2 N KOH; a f t e r standing f o r f i v e minutes, 3% H202 i s addedd. The yellow c o l o r developped i s measured c o l o r i m e t r i c a l l y (79). U1t r a v i o l e t Spectrophotometric Method
Pyrazinamide can be determined by measurement o f the absorbance a t 269 nm i n aqueous solution. E (l%, 1 cm), a t 269 nm = 655 (80). 9.7
Compl exometric Analysis
The method i s based on the formation o f the complex Pyrazinamide-HgC1 (m.p. 245°C) from a c i t r i c acid s o l u t i o n containing an excess o f HgC12. 2 A f t e r f i l t r a t i o n o f the complex, the excess o f reagent i s t i t r a t e d w i t h a s o l u t i o n o f Complexon 111 using Eriochrome I black (pH = 10) as indicat o r (81).
9.8
Chromatography
9.8.1
Paper chromatography
Pyrazinamide paper chromatography has been reported i n d i c a t i n g f i v e systems and a v a r i e t y o f v i s u a l i s i n g reagents (32,82) as suitable. The solvent systems used were: a)
4.8 g o f c i t r i c acid i n a mixture o f 130 m l water and 870 m l o f n-butanol,
b)
Acetate b u f f e r (pH = 4.58)
c)
Phosphate b u f f e r (pH = 7.4)
d)
Butyl acetate
e)
n-Butanol
-
- acid a c e t i c - water
(5:l:l)
HC1 1N ( 1 : l )
Using Whatman N 1 f i l t e r paper the f o l l o w i n g R f values were obtained: 0.56 (a), 0.83 (b), 0.80 (c), 0.57 (d), 0.58 (e). The spots were visualized using e i t h e r : 1)
2) 3) 4)
UV l i g h t Potassium permanganate spray reagent (1% aqueous sol .) Iodoplatinate spray reagent Water s o l u t i o n o f 4% nitroprusside and NaOH 4N (1:l)
455
PYRAZINAMIDE
9.8.2
Thin layer chromatography
TLC methods for the separation and detection of Pyrazinamide are summarized in the table 1 1 Table 1 1 Solvent system
Plate
Rf 0.63 0.26
I
A
I1 I11
B B
IV
B
V VI VII
0.44 0.79 0.76 0.48
B B C
--
Reference 19 73 73 73 73 57 70
Solvent System:
I Conc. ammonia : methanol (1.5 : 100) I1 Toluene : Ethyl acetate : 85% formic acid (50:45:5) I11 Toluene : isopropanol : conc. ammonia (70:29:1) IV Toluene : ethyl acetate : isopropanol : acetic acid (10:35 :35:20) V Toluene : dioxane : methanol : conc. ammonia (20:50:20:10) V I Chloroform : methanol : conc. ammonia (20:20:1) VII Benzene : chloroform : acetic acid (8:l:l) Plate:
A Silica gel G
B Kieselgel 60F 254 (Merck) C A1203 60F 254 (Merck)
Detection systems: Iodine - carbontetrachloride spray reagent UV light at 254 nm Sodium nitroprusside 4% NaOH 4N (1:l) Picryl chloride 1.5%
-
A direct detection with diphenylamine 0.1% is reported (81).
9.8.3
Gas chromatography
A gas-chromatography method has been described for the determination of Pyrazinamide, using a glass column (1.8 m) of Versamide 900 on Chromosorb W silanized (100-120 mesh), operated at 165" with N2(50 ml/ m) as carrier gas and a FID detector (83).
-
GLC of Pyrazinamide with lithium iodide containing poly-(ethylene glycol) as stationary phase was reported (84).
ERNST FELDER AND DAVIDE PITRB
456
GC/MS of TMS derivatives o f Pyrazinamide was done for methabolic studies operating between 120’ and 180’ with a column packed with 3% OV-101 on Chromosorb W 80-100 mesh (67). 9.8.4
High pressure liquid chromatography
A HPLC method for quantitative determination of Pyrazinamide and separation from pyrazinoic acid has been developed (85).
The operating conditions are as follows:
- Apparatus: - Column : -
-
Hewlett-Packard 10 25 cm X 4 mm’!abiH column packed with Lichrosorb RP8 (7 Injection: 20 I1 o f aqueous solution (about 10 mg/ml o f Pyrazinamide) Eluent A : iqueous 0.005 M tetrabutylammonium phosphate (pH 7.5) Eluent B : 0.005 M tetrabutylammonium phosphate in than01 - water 8:2 (v/v) Flow rate : 1.5 ml/min Gradient profile: Minutes
% Eluent 8
5 5 45 45 5 (reconditioning step) stop
0
2 10 11 13 18
- Column temperature: 25’C - Detector wavelenght: 254 nm - Relative retention time: pyrazinoic acid: Pyrazinamide:
9.9
1.9 min. 1 min.
Counter Current Distribution
A counter current distribution of Pyrazinamide in an automatic Craig machine by partitioning into 29 tubes using the solvent system ethyl acetate 0.01N sodium hydroxide (K = 0.49 5 0.01) has been performed (64).
-
-
For pyrazinoic acid the distribution is possible with the solvent system ethyl acetate 0.01N sulfuric acid ( K 0.44 5 0.01).
-
9.10
Pol arography
Quantitative determinations by polarography o f Pyrazinamide and its metabolites in human tissues and pla- * - have been reported (86,87,67).
PYRAZINAMIDE
JO.
451
Determination of pyrazinamide in body fluids and Tissues
Most of the methods referred in this section are similar to other general analytical methods, a1 ready described with differences only in the extraction procedures. At first colorimetric methods, based on reaction of Pyrarinamide, or o f its hydrolysis products, with Ferrous Ammonium Sulphate (78), Alkaline Nitroprusside (64,70), Cobalt Chloride (79) were used. Later, spectrophotometric measurements (80) or polarographic methods (65) without prior separation from a biological fluid (86,87) were preferred. A combined gas chromatographic-mass spectrometric technique (67) for s i mu1 taneous identification and quantitative determination of Pyrazinamide and its main metabolites in serum and urine of human subjects was descri bed. A microbiological assay using a Pyrazinamide sensitive Mycobacterium
strain (72) is also reported,
ERNST FELDER AND DAVIDE PITRE
458
11.
REFERENCES
1. Annual meeting o f the IUAT, Prague, June 1-8 (1980) 2.
Report o f a J o i n t IUAT/WHD Study Group, Technical Report Series 671 (1982)
3.
Dalmer, Walter, Ger.pat. 632.257 (1936 t o E. Merck)
4.
S. Kuschner, H. Dalalian, R.T. Cassell, J.L. Sanjurjo, 0. MacKenzie and Y. Subba Row, J.Org.Chem., 13, 834 (1948)
5.
L. Malone e t al.,
6.
R.M. McCune, F.M. Feldmann, H.P. 445 (1966) J.Exp.Med.,
7.
R.M. McCune, F.M. 469 (1966)
8.
F. Grumback, Ann. Inst.Pasteur,
9.
-
Rev.Tuber. 65, 511 (1952)
123,
Lambert, W. McDermott,
Feldmann, W. McDermott, J.Exp.Med,,
94, 694
123,
(1958)
W. Fox, B u l l e t i n o f the I n t e r n a t i o n a l Union Against Tubercu3-4, 135 (1981)
l o s is , 56,
2,
10
East A f r i c a n / B r i t i s h Medical Research Councils, Lancet, 237 (1974)
11.
East A f r i c a n / B r i t i s h Medlcal Research Councils, Rev. o f Resp. Dis., 471
12.
East A f r i c a n / B r i t i s h Medical Research Councils, Rev. o f Resp. Dis., 39 (1978)
13.
Hong Kong Chest Service/British Medical Research Councils, 171 (1981) Lancet
14.
U.S.P.
15.
Jap.
P. I X
16.
B.P.
1980: Monographs: Pyrazinamide Vol. 1, pag. 379
17.
C. Tamura, Nippon Kagaku Eashi,
18.
Shigom Ioshida, Chem. Pharm. B u l l .
19.
M. Grandi, Bracco S.p.A.,
20.
A. Lautie, F. Froment, A. Novar, Spectrosc. L e t t .
114,
118, 1,
XX O f f i c i a l Monographs: Pyrazinamide Tablets, pag. 692
3, 971
(1962)
z,628 (1963)
Milan, personal comunication
9,
289 (1976)
459
PYRAZINAMIDE
21. J. Bus, Th.J. Liefken, W. Sehwaiger, Rec.Trav.Chim., 92, 123 (1973) 22.
11,1645
R.H. Cox, A.A. Bothner-By, J. Phys. Chem.
Pays Bas, (1968)
23. G.G. Dvoryantseva, V.P. Lezina, V. Bystrv, T.N. Ulyanova, G.P. Syrova, Yu.N. Sheinker, 1zv.Akas.Nauk; SSSR, Ser. Khim., 994, ( 1968) 24. G.S. Marx, P.E. Spoerri, J.Org.Chem.
2, 1 1 1 (1972)
25. G.P. Syrova, Yu.N.Sheiker, I.S. Musatova, A.S. Elina, Chim.Geterosik1. Soedin. 266 (1972) 26. G.P. Syrova, Yu.N.Sheiker, Chim.Gererosik1 .Soedin. 345 (1972) 27. Bracco S.p.A.
Milan, unpublished results
28. Bracco S.p.A.
Milan, unpublished results
29. Bracco S.p.A.
Milan, unpublished results
Bracco S.p.A.
Milan, unpublished results
30.
31. The Merck Index IX Ed., 7740
2, 1699
32. E. Felder, D. Pitre, U. Tiepolo, Min.Med. 33. C. Tamura, H. Kowano, Acta Cryst.
2, 693
(1962)
(1961)
34. Y. Takaki, Y. Sasada, T. Watanabe, Acta Cryst.
13,693 (1960)
B, 1677 (1972)
35. G. Ro, H. Sorum, Acta Cryst. G. Ro, H. Sorum, Acta Cryst. Q,
991 (1972)
36. 6. Liborio, University o f Milan, Institute o f Mineralogy, personal comnunication 37. H. Negoro, Takamine Kenkyusho Nempo, lJ, 38. M. Grandi, Bracco S.p.A., 39. M. Grandi, Bracco S.p.A.
66 (1959)
personal communication
, personal
comnunication
40. P:P. Singh, J.N. Seth, J.Inorg.Nucl.Chem.,
2, 593
41. A. Tenhunen, Suom.Kemistilehti, B
42,
42. A. Tenhunen, Suom.Kemistilehti, B
43, 506 (1970)
361 (1969)
(1975)
ERNST FELDER AND DAVIDE PITRE
43. A. Tenhunen, Suom.Kemistilehti, 6 2, 97 (1970) 44. A. Tenhunen, Ann.Acad.Sci.Fen.,
Ser.A
45. A. Tehnunen, Suom.Kemistilehti, B
2, 161
45,
(1971)
'81 (1972)
46. M. Sekizaki, Acta Crystallogr. Sect. B 29, 327 (1973 47. T.A.Azizov, O.F. Khodzhaev, N.A. Perpiev, Koord.Khim. Q, 1234, ( 1978) 48. K. Brodersen, N. Hacke, B
107, 3260
(1974)
49. P.P. Singh, J.N. Seth, S.A. Khan, 1norg.Nucl.Chem.Lett. 525 (1975) 50. S.C. Jain, M.S. Gill, G.S. Rao, J.Indlan.Chem.Soc., ( 1976)
11,
2, 537
51. O.F.Khodzhaev, E.K. Khudaiberdiev, Kh. Kh. Khatimov, Koord.Khim. 5, 689 (1979) 52. Kh. Kh. Khakimov, E. Khudaiberdiev, M.A. Atizov, Mater. Yubileinoi Resp.Nauchn.Konf .Farm., Posuyashch. 50-Letiyu Obrat. SSR, 138 (1972) 53. S. Kushner et al., J.Am.Chem.Soc. 54. U.S. Patent 2.627.641
74,3617-3621
(1954 to Am. Cyanamid)
55. R.L. Yeager et al., Am.Rev.Tuber.
65,
523 (1952)
56. J .A. Solomons, P. E. Spoery, J.Am.Chem.Soc. 57. S.Gabrie1, A. Sonn, B
(1952)
40, 4851
58. Brit.pat. 566653 (1945 to CA
75, 679 (1953)
(1907)
41, 1251)
59. Swiss pat. 415645 (1967 to Eprova A.G.) 60. H. Gainer, J.Org.Chem.
24, 691
(1959)
61. Fr.pat. 1,331.102 (1963 to Merck & Co.)
62, H. Foks et al., Acta Pol.Pharm. 49-54 (1976) 63. U. Tiepolo, Bracco S.p.A., 64. G.A. Ellard, Tubercle
Milan, unpublished data
3, 144
(1969)
461
PYRAZINAMIDE
65. I.M. Weiner, J. Tinker, J.Pharm. & Exper.Therap. 66. G.M. Fanelli, I.M.
180, 411
(1972)
Weiner, J.Clin.Invest. 52, 1946 (1973)
67. 3. Roboz, R. Suzuki, Ts'ai-Fayu, J.Chrom.
147, 337
(1978)
68. D.Pitre, R. Maffei Facino, M. Carini, G. Avarone, Pharm. Res. Commun. 13, 951 (1981) 69. I. Troida, Amer.Reu.Resp.Dis.,
107, 630 (1973)
70. P.A. Caccia , Amer.Rev. of Tub.and Pulm.Dis.
75,
105 (1957)
71. G.Grassi, 6. Tansini, F. Leidi, G. Perna, Atti Soc.Lomb. Sc.Med.-Biol. 14,10 (1959) 72. K.D. Stottmeier, R.E. Beam, G.P. Kubica, Am.Rev. of Res.Dis. 98, 70 (1968) 73. F. Boulahbal, S. Khaled, H. Bouhassen, D. Larbaoui, Le Pyrarinamide 25 ans apres, Symp.Alger, 35 (1979)
74. J. Grosset, Tubercle
2, 519
75. P.G. Venosta, Bracco S.p.A., 76. E.Boldrini, Bracco S.p.A.,
(1978) Milan, personal communication
Milan, personal communication
77. G. Mascellani, C. Casalini, Anal.Chem.
47, 2468
(1975)
78. W.S. Allen, S.M. Aronovic, L.M. Biancone, J.H. Williams, Anal. Chem. 25, 895 (1953) 79. D. Aoki, Y. Ivoyama, K. Furusumi, Yakuzaigaku 80. S. Chiba, Takamine Kenkyujo Nempo
8,
81. V. Ignat, T. Costantinescu, Farmacia
E,9 (1956)
132 (1956)
16, 151
(1968)
82. E.G.C. Clarke, Isolation and Identification of drugs, The Pharmaceutical Press - London, 1969 83. A. Cal7, C. Cardini, V. Quercia, Boll.Chim.Farm.
108,175
84. N. Amaguchi, T. Nakagawa, T. Uno, J.Chrom.170, 81 (1979)
85. M.Grandi, Bracco S.p.A.,
Milan, personal communication
(1969)
ERNST FELDER AND DAVIDE PITRE
462
Svoboda, J.A.P.A.
45,
504 (1956)
86.
ti.K.
87.
P.O. Kane, Nature 183, 1674 (1959)
PYRIMETHAMINE Mohammed A . Loutfy and Hassan Y. Aboul-Enein 1. Description
2.
3. 4.
5.
1 . 1 Nomenclature 1.2 Formulae 1.3 Molecular Weight 1.4 Elemental Composition 1.5 Appearance, Colour, Odour, and Taste 1.6 Dissociation Constant Physical Properties 2.1 Melting Point 2.2 Solubility 2.3 Identification 2.4 Spectral Properties Synthesis Metabolism and Pharmacokinetics Methods of Analysis 5.1 Gravimetric Method 5.2 Titrirnetric Method 5.3 Chromatography 5.4 Spectrophotometric Analysis 5.5 Nuclear Magnetic Resonance References
ANALYTICAL PROFILES OF DRUG SUBSTANCES VOLUME 12
463
464 464 464 465 465 465 465 465 465 465 465 466 47 1 474 474 474 475 475 477 478 479
Capynghl by [he American Pharmaceutical Association lSRN0-12~260812-7
464
MOHAMMED A. LOUTFY AND HASSAN Y. ABOUL-ENEIN
1. Description 1.1. Nomenclature 1.1.1. Chemical Names 5- (4-Chlorophenyl)-6-ethyl-2,4-pyrimidinediamine (1); 2,4-Diamino-5-(p-chlorophenyl)-6-ethylpyrimidine ( 2 ) ; 5-(4-Chlorophenyl)-6-ethylp yrimidine-2,4diamine (3,4) ; 2,4-Pyrimidinediamine, 5-(4-chlorophenyl)-6ethyl (5). 1.1.2. Generic Names
Pyrimethamine; Pyrimethaminum; BW 50-63; RP 4753. 1.1.3. Trade Names Daraprim; Chloridin; Darapram; Malocide; Supacox (with amprolium hydrochloride, ethopabate, and sulphaquinoxaline); Maloprim (with dapsone); Fansidar (with sulphadoxine available only in certain overseas countries (4)) ; Whitsyn S (with sulphaquinoxaline)
.
1.2. Formulae 1.2.1. Empirical C12H13C1N4 ' 1.2.2. Structural
c1
(0 NHZ
PYRIMETHAMINE
465
1.2.3. Wiswesser Line Notation T6NCNJ BZ D
Z ER DC and F2 (6). 1.2.4. Chemical Abstract Registry Number 58-14-0 (6). 1.3. Molecular Weight 248.71
1.4. Elemental Composition C, 57.94%; H, 5.27%; C1, 14.25%; N,
22.53%.
1.5. Appearance, Colour, Odour, and Taste A white, crystalline powder, odourless and tasteless.
1.6. Dissociation Constant pKa 7 at 2 0'
2.
(4).
Physical Properties 2.1. Melting Point 233-234' 239-242'
(capillary) ; 240-242' (copper block) (1); (3,7); 235-236' (8); 237-238' (9).
2.2. Solubility Practically insoluble in water; slightly soluble in ethanol (about 9 gm/litre), in dilute HC1 (about 5 gm/litre), in acetone and in chloroform (1 gm/125ml). Very sparingly soluble in propylene glycol and dimethylacetamide at 70°. Soluble in boiling ethanol (25 gm/litre), and in warm dilute mineral acids. 2.3. Tdentffication The following identification tests have been described (2-5) : a.
Dissolve 0.05 gm in 5 ml dilute sulphuric acid and add 0.2 ml of alkaline potassio-mercuric iodide; a creamy-white precipitate is formed.
MOHAMMED A. LOUTFY AND HASSAN Y.ABOUL-ENEIN
466
b.
Ignite 0.1 gm with 0.5 gm of anhydrous sodium carbonate, extract the residue with water, and filter. The filtrate, after neutralisation with nitric acid, yields the reactions characteristic of chlorides.
c.
Identity tests for pyrimethamine have been reported ( l o ) , utilising alkaloidal precipitants and preparation of the 2,4-diacetyl derivative, m.p. 172O (from 50 X ethanol). Microcrystal Tests Gold bromide - hydrochloric acid solution produces serrated needles (sensitivity:lin 1000); Potassium chromate solution forms irregular blades (sensitivity: 1 in 1000) (11).
2.4. Spectral Properties 2.4.1. Ultraviolet Spectrum The UV spectrum of pyrimethamine, in aqueous acidic solution, was scanned in the region of 400-200 nm using a Pye-Unicam SP 8-100 Ultraviolet spectrometer, and is shown in Figure 1. The UV spectrum of a solution in 0.005 N HC1 exhibits a maximum at about 272 nm (El%, 1 cm = 320), and a minimum at about 260 nm. In alcohol (95%), maximum at 287 nm (El%, 1 cm = 365) (2,4,11). The UV spectrum of pyrimethamine in alcoholic NaOH shows a maximum at 286 nm as shown in Figure 2. 2.4.2. Infrared Spectrum The IR spectrum of pyrimethamine in KBr-disc is shown in Figure 3. The IR spectrum was recorded on a Perkin Elmer 580B Infrared spectrometer. The structural assignments have been correlated with the band frequencies represented in Table 1.
467
PYRIMETHAMINE 1
90.
-90
70.
- 80 - 70
60.
- 60
50.
- 50
40.
-40
30.
.30
2 0.
- 20
10-
- 10
80.
.
1
W a v e Leng t h
Fig. 1.
W SPECTRUM OF PYRIMETHAMINE IN 0.005 N HC1.
90. 80.
- 90 - 80
70.
- 70
60.
- 60
50-
- 50 - 40
403020-
. 30 .20
10-
. 10
MOHAMMED A. LOUTFY AND HASSAN Y.ABOUL-ENEIN
468
Table 1. IR Characteristics of Pyrimethatnine Frequency Cm-1
Assignment
3310
34403
NH asymmetric and symmet2 stretch. ric
3130
C-H aromatic stretch.
1650
C=N aromatic stretch.
1560 1630}
C=C aromatic stretch and substituted aromatic ring.
1470 1430) 1410 1090
CH3 and CH2 bending stretch C-H deformation of chlorosubstituted aromatic ring.
990
Chloro-substituted aromatic ring.
830
C-H deformation of psubstituted aromatic ring.
8101
C-H out of plane bending vibration.
750
The above assignments ,re in agreement with published data (6). 2.4.3. Nuclear Magnetic Resonance Spectrum 2.4.3.1. Proton Spectrum The PMR spectrum of pyrimethamine in deuterated dimethyl sulfoxide (DMSO-d6) was recorded on a Varian T-60A, 60-MHz NMR spectrometer using TMS as an internal standard. The spectrum is shown in Figure 4 . The structural assignments have been made in Table 2.
\
Fr
0
m b0 .rl
Fr
Fig. 4 .
PMR SPECTRUM OF PYRIMETHAMINE IN DMSO-d6, USING TMS AS AN INTERNAL STANDARD.
PYRIMETHAMINE
471
Table 2. PMR Characteristics of Pyrimethamine Proton Assignments CH3CH2CH3CH2-
Chemical Shift (6) 0.97
(t)
NH2 at C4 -
2-00
(9)
5.5
(bs)
NH2 at C2
5.8
(bs)
-
Exchangable with D 2 0 Four aromatic protons of p-chlorosubstituted phenyl
7.3 (m) --G n g---------------------------------------
t=triplet; q*quartet; bssbroad singlet; momultiplet 2.4.3.2. 15N-NMR Stadeli et al. (12) have reported the 15N-NMR spectra for several aminopyridines and aminopyrimidines including pyr imethamine. The assignments of "N-NMR for pyrimethamine is represented in Table 3.
.
Table 3. "N-NMR
N(1)
of Pyrimethamine
N(2) N(3) -176.3 -300.9 -176.3 -247.5 -294.5 -247.5 -249.9 -250.7 -295.8 a=dimethyl sulphoxide at 6 0 ' . b=trifluoroacetic acid. c-fluorosulphonic acid.
N(4) -299.4 -274.9 -274.5
-----------------c--__c_________________-------
Solvent a b C
472
MOHAMMED A. LOUTFY AND HASSAN Y. ABOUL-ENEIN
2.4.4. Mass Spectrum The mass spectrum of pyrimethanmine is shown in Figure 5. The most prominent ions and their abundances are shown in Table 4 ( 1 3 ) . Table 4. Mass Spectrum of Pyrimethamine Mass (m/e)
Fragment
Abundance %
247
M-1 due to 100 (base peak) C1-35 isotope.
248
M+
249
36 M+1 due to C1-37 isotope.
250
-
15
219
M-C2H5
12
50
Figure 5 shows a molecular ion peak at m/e = 248, and peaks at 247, 249 and 250 which represent the natural isotopic abundance for chlorine and M+1 peak ( 1 3 ) . Other peaks appear at m/e = 212 (10%); m/e = 232 (5%); and m/e = 106 (5%). The fragmentation pattern of pyrimethamine follows the general fragmentation patterns of 2-aminopyrimidines (14-16)
.
3.
Synthesis Various synthetic procedures have been described for pyrimethamine, starting from open-chain compounds and different reactions of cyclization. a.
Ethyl propionate is condensed with p-chlorophenyl acetonitrile, in the presence of sodium methoxide (17). The resulting a-propionyl-p-chlorophenyl acetonitrile I is converted into the hemiketal by reaction with isoamyl alcohol, ethyl orthopropionate (18-20) or with dimethyl sulphate (8). The hemiketal undergoes dehydration to a-(p-chloropheny1)-6-ethyl$-alkoxyacrylonitrile. The later is then reacted with guanidine or guanidine HC1 whereupon cyclization occurs due to liberation of alcohol and an addition reaction involving an amino group of guanidine and the nitrile group (Scheme 1).
100-
80.
60
-
40.
Fig. 5.
MASS SPECTRUM OF PYRIMETHAMINE.
NCCH2C6H4Cl(p)
CH30Na
+ CH3CH2COOEt
>
R=iso-C H
I
5 11;
=C2H5 ; =CH3
/ NH2
:2H5
‘
HN=C-
p-ClC H
NH, H2‘@ANH2 Scheme 1
b.
Logemann e t a l . ( 9 ) have p r e p a r e d t h e drug by h e a t i n g a-propionyl-p-chlorophenyl a c e t o n i t r i l e (I) w i t h a n i l i n e and t r e a t i n g t h e p r o d u c t w i t h t h e c a l c u l a t e d amount of N a / C H OH and c y c l i z i n g w i t h g u a n i d i n e 2 5 (Scheme 2 ) . PhNH2
I
T>
NC-HC-C6H4C1 I I PhN=C-C2H5
NC-C-C6H4C1
II Ph-HN-C-C
2H5
(p-)
Enolisation
,
\
(p->
HN=C (NH2)
Scheme 2
Pyrimethamine
475
PYRIMETHAMINE
c.
Jacob (21) has patented the synthesis of pyrimethamine as shown below (Scheme 3). Et
1) Chlorination 2) NH3
>
L
Pyrimethamine
Scheme 3 Several reports and patents are listed in the literature for the synthesis of the drug (22-31).
4. Metabolism and Pharmacokinetics After an oral dose, a peak plasma concentration is reached in about 2 hours. During therapy with 50 mglday, plasma concentration of 0.3 - 0.6 pg/ml is attained. The plasma half-life for pyrimethamine is about 90 hours (4). Several authors (32-33) have studied the pharmacokinetics of the drug in combination with dapsone and sulfalene in human volunteers. Recently, Yamaoka et a1.(34) have studied the tissue distribution of orally administered pyrimethamine to pigs. Pyrimethamine affects the nucleoprotein metabolism of the malarial parasites by interference in the folic-folinic acid systems and its action is exerted mainly at the time when the nucleus divides. It has little effect upon immature schizonts in the red corpuscles and therefore it is slow to control a malarial attack; its chief value is as a suppressant. It has been observed (11) that about 1. mg still remains in the body 30 days after a single dose of 100 mg. Pyrimethamine is excreted in the milk of nursing mothers. Several metabolites of pyrimethamine appear in the urine; little is known of their structure or antimalarial activity (11). 5. Methods of Analysis 5.1. Gravimetric Method Drey (10) has reported the assay and identification of pyrimethamine and its preparations. In this method, pyrimethamine is determined gravimetrically by precipitation from 5% H2S04 solution with
MOHAMMED A. LOUTFY AND HASSAN Y. ABOUL-ENEIN
476
phosphotungstic acid, washing with 2% H2S04, and drying at 500 for 2 hours or over P2O5 in vacuo for less than 4 hours, then heating at atmospheric pressure at 110' for 1.5 hours. Each gm is equivalent to 0.2040 gm of C12H13N4C1. 5.2. Titrimetric Method Non-aqueous Most pharmacopoeias (2,3,5) recommend the quantitative determination of pyrimethamine by non-aqueous titration, using quinaldine red as an indicator and 0.1 N acetous perchloric acid as a titrant. 5.3. Chromatography 5.3.1. Paper Chromatography Clarke (11) has described several solvent systems for identification of the drug as shown in Table 5. Table 5.
Solvent System used in Paper chromatography of pyrimethamine.
Solvent System
Visualizing Agent
Rf
1. Citric acid-water-nbutanol (4.8 gm: 130 ml: 870 ml).
W , iodoplatinate
0.42
spray
2. Acetate buffer (pH=4.58)
w
0.42
3 . Phosphate buffer
uv
0.08
.
(pHe7.4)
.
5.3.2. Thin-Layer Chromatography Serfontein et al. (35) have reported a rapid and comprehensive system for the routine identification of pyrimethamine, and other drugs, in biological materials. The method is based on the separation of the drugs from 2-propanol extracts of serum, urine and tissue homogenates at different pH values
477
PYRIMETHAMINE
using microphase extraction techniques followed by examination with two-dimensional thin-layer chromatography. The drugs are visualized after spraying with various chrome genic and fluorogenic reagents. Identification of pyrimethamine has been also carried out (11) by using strong ammoniamethanol (1.5:lOO) as solvent system and the drug is visualized after spraying with acidified iodoplatinate. De Angelis et al. (36) have determined the drug, in biological fluids (plasma and urine), by thin-layer chromatography. 5 . 3 . 3 . Gas-Liquid ChromatograDhy
Jones et a l . ( 3 7 ) have described an assay of pyrimethamine in human plasma by GLC. In this method, samples, prepared by extraction of plasma containing pyrimethamine and the internal standard BW197U toluene, were analyzed using a column of 10% OV-17 on Chromosorb W HP with N as the carrier gas. The injection port, column, and detector were at 300, 2 3 5 , and 3500, respectively. After the internal standard was eluted the column temperature was increased at 160/minute to 2800 for 4 minutes. Pyrimethamine and the internal standard had retention times of 7 . 3 and 10.8 minutes, respectively. Quadruplicate samples of pyrimethamine gave a coefficient of variation of 5 . 5 % for pyrimethamine plasma concentrations of 5-400 ng/ml. Pyrimethamine and the internal standard gave recoveries of 75.6 and 7 4 . 7 % , respectively, which also were independent of concentration. The minimum detectable amount of pyrimethamine was 5 0 pg; plasma concentrations of 5-400 ng/ml are comEortably assayed. In contrast to other more sensitive methods, this method has smaller errors and allows replicate injections of a sample; pyrimethamine plasma levels can be monitored in human volunteers for several weeks after administration of a single 25 mg dose of pyrimethamine.
478
MOHAMMED A. LOUTFY AND HASSAN Y.ABOUL-ENEIN
Bonini et al. ( 3 8 ) have described a gas chromatographic determination of four antimalarials, including pyrimethamine, singly and in a mixture in biological media. In this method, pyrimethamine has been determined in blood and urine using a column packed with 2% OV-17 on Chromosorb W AW DMCS 100-120 mesh with N gas as the carrier gas and the column temperature programmed to increase from 250 to 3500 at 8Olminute. The limit of detection was 0.191 ng for pyrimethamine. The recoveries in blood and urine were 82.3 and 89.5%, respectively for 0.75 ug pyrimethaminelml. Other gas-liquid chromatographic methods for pyrimethamine has been reported (39-41). 5.3.4. High Performance Liquid Chromatography Yamazaki et al. (42) have reported an HPLC assay for pyrimethamine and several antibiotics, in food samples. The drugs were simultaneously extracted from food samples with acetonitrile. The extract was then subjected to HPLC with a Zorbax sil column, using W detector at 284 nm. The detection limit for pyrimethamine was 0.4 m m . Jones and Ovenell ( 4 3 ) have devoloped a highperformance liquid chromatographic method for simultaneous determination of pyrimethamine and dapsone in plasma. The solvent system, consisting of di-isopropyl ether-methanol-21% aqueous NH40H (96 : 4 : 0.1) at a flow-rate of 2 ml/minute, passed through column packed with 5-um spherical silica (Spherisorb S5W) Metoprine, an analogue of pyrimethamine, was used as an internal standard. The limit of detection was about 5 ng injected for pyrimethamine
.
.
5-4. Spectrophotometric Analysis 5.4.1. Colorimetric Recently, Sane and Dhamankar (44) have developed an extractive colorimetric determination of pyrimethamine in pharmaceutical preparations. In this method, pyrimethamine
PYRIMETHAMINE
479
is determined by formation of a chloroformextractable colored species (maximum absorbance at 415-420 nm) by reaction with bromocresol purple, bromophenol blue, methyl orange, picric acid, or bromothymol blue, in a medium of pH 1-4.5. The recovery ranges from 99.4 to 101.17%. Other colorimetric methods for the assay and identification,ofpyrimethamine have been reported (5, 41, 45). The determination is based on an acid dye ion-pair extraction of the color formed with bromocresol green and measuring at 622 nm. One of the methods (41) is suitable for determination of the drug at 5 mg/kg level of feed. 5.4.2.
Ultraviolet The method officially adopted by U . S . P . XIX (6) for the quantitative determination of pyrimethamine tablets involves spectrophotometric assay. The absorbance of the test solution and standard preparation is measured in 1 cm cells at 273 nm.
5.5. Nuclear Magnetic Resonance Girgis and Askam (46) have described determination of pyrimethamine by NMR spectroscopy. The 60-MHz NMR spectrum of the drug, in trifluoroacetic acid solvent and using anhydrous caffeine as an internal standard, is recorded. The method is based on the integration of selected peaks of the characteristic resonance pattern of pyrimethamine-and those of caffeine. The coefficient of variation was 1.96%. Acknowledgement The authors wish to thank F. Hoffman-La Roche & Co. Limited, Basle, Switzerland, for donating a sample of Pyrimethamine Lot No: 654351.
MOHAMMED A. LOUTFY AND HASSAN Y . ABOUL-ENEIN
480
6.
References 1.
M. Windholz, "The Merck Index", 9th Ed., Merck & Co. Inc., Rahway, N.J., U.S.A., 1976, p. 1036.
2.
"Specifications for the Quality Control of Pharmaceutical preparations", 2nd Ed., World Health Organization, Geneva, 1967, p. 507.
3.
"British Pharmacopoeia", Vol. 1, Her Majesty's Stationary Office, London, 1980, p. 381.
4.
"The Pharmaceutical Codex", 11th Ed., The Pharmaceutical Press, London, 1979, p. 767.
5.
"The United States Pharmacopoeia'', XIX, Mack Publishing Co., Easton Pa., 1965, p. 430.
6.
G.C.G. Grasselli and N.M. Ritchey, "Atlas of Spectral Data and Physical Constants for Organic 4, CRC Press Inc., Compounds", 2nd Ed., Vol. Cleveland, Ohio, 1975, p. 422.
7.
Martindale, The Extra Pharmacopoeia, 27th Ed., Pharmaceutical Press, London, 1977, p. 354.
8.
M. Furukawa, Y. Set0 and S. Toyoshima, Chem. Pharm. Bull. (Tokyo),
9.
2,
914 (1961).
W. Logemann, L. Almirante, and L. Caprio, Chem. Ber. Chem. Abstr. 9, 4660 (1955).
87, 435 (1954);
10. R.E.A. Drey, J. Pharm. and Pharmacol. 9, 739 (1957). 11.
E.G.C. Clarke, "Isolation and Identification of Drugs", Vol. 1,Pharmaceutical Press, London, 1978, p . 528.
12.
W. Stadeli, W.V. Philipsborn, A. Wick, and I.Kompis, Helv. Chim. Acta, 63, 504 (1980).
13.
E. Stenhagen, S. Abrahamsson, and F.W. McLafferty, 2, John "Registry of Mass Spectral Data", Vol. Wiley & Sons Inc., 1974, p. 1172.
14.
J.M. Rice, G.O. Dudek, and M. Barber, J. Amer. Chem. SOC., 87,4569 (1965).
15.
T. Nishiwaki. Tetrahedron 22. 3117 (1966).
PYRIMETHAMINE
481
16. Ibid, 23, 1153 (1967). 17.
"Remington's Pharmaceutical Sciences", 15th Ed., Mack Publishing Co., Easton, Pennsylvania, 1975, p . 1157.
18. "Bentley and Driver's Textbook of Pharmaceutical Chemistry", 8th Ed., L.M. Atherden, Oxford University Press, London, 1969, p . 656.
19. P.B. Russell and G.H. Hitchings, J. Amer.Chem.Soc., 73, 3763 (1951). 20. P.B. Russell and N. Whittaker, Ibid, 74, 1310(1952). 21. R.M. Jacob, U.S. 2, 680, 740, June 8, 1954; through Chem. Abstr. 49, 7007 (1955). 22. J.W. Mentha, J.V. Shaffner, and R.M. Cresswell, Patent U . S . 3 , 939, 181,Feb. 17, 1976; through Chem. Abstr.-E, 46734 (1976). 23. R. Baltzly and P.B. Russell, J. Org. Chem. (1956). 24.
25.
21,
912,
G.H. Hitchings, P.B. Russell, and E.A. Falco, U.S. 4, 1951; through Chem. Abstr. 46, 6162 (1952).
-2, -576, - 939, Dec.
Ibid, U.S. 2, 602, 794, July 8, 1952; through Chem. Abstr. 47,4921 (1953).
26. Burroughs, Wellcome and Co. Inc., Brit. 749, 051, May 16, 1956; through Chem. Abstr. 51, 16568 (1957). 27. N. Whittaker, Brit. 750, 017,June 6, 1956; through 51, 1272 (1957). Chem. Abstr. 28.
N. Whittaker, Brit. 743, 221, June 11, 1956;through Chem. Abstr. 51, 2038 (1957).
29. G.H. Hitchings, P.B. Russell, and N. Whittaker, J. Chem. SOC., 1019 (1956). 30.
R.M. Jacob, Fr, 1, 070, 420, July 26, 1954; through Chem. Abstr. 53,-43=(1=). I
MOHAMMED A. LOUTFY AND HASSAN Y.ABOUL-ENEIN
482
31.
G.H. Hitchings and P.B. Russell, Ger. 934, 947, Nov. 10, 1955; through Chem. Abstr. 53, 7213 (1959).
32.
L. Donno, G. Vocaturo, C. Pollini, J.O. Ekanem, Curr. Ther. Res. 27, 346 (1980).
33.
R.A. Ahmad and J.H. Rogers, Br. J. Clin. Pharmacol.
10, 519 (1980).
34. R. Yamaoka, H. Yamamoto, and M. Kohanawa, Annu. Rep. Natl. Vet. Assay Lab., 16,63 (1980); through Chem. Abstr. 94, 24665 (1981). 35.
W.J. Serfontein, D. Botha, and L.S. DeVilliers, J. Chromatogr. 115,507 (1975).
36.
R.L. De Angelis et al., J. Chromatogr. (1975).
37.
C.R. Jones, P.R. Ryle, and B.C. Weatherley, J. Chromatogr. 224, 492 (1981).
38.
106,41
M. Bonini, F.Mokofio, and S. Barazi, J. Chromatogr. 332 (1981).
224,
39. P.C. Cala, N.R. Trenner, R.P. Buhs, G.V. Downing, J.L. Smith, and W.J.A. VandenHewel, J. Agr. Food 20, 337 (1972). Chem. -
40. J.R. Harris, P.G. Baker, and J.W. Munday, Analyst, 102, 873 (1977).
41. Analytical Methods Comittee, Analyst, (1981). 42.
106,1208
T. Yamazaki, H. Hironaka, K. Kindo, and Y. Yamamoto,
Fukuoka-shi Eisei Shikenshoho, 5, 96 (1979); Chem. Abstr. 95, 5231 (1981).
43. C.R. Jones and S.M. Ovenell, J. Chromatogr.,w, 179 (1979).
44. R.T. Sane and A.Y. Dhamankar, Indian Drugs, 19,80 (1981); Anal. Abstr. 43, 75 (1982). 45. Analytical Methods Committee, Analyst, =,764(l977).
46. P. Girgis and V. Askam, J. Ass. Publ. Analyst, 55 (1974).
12,
QUINIDINE SULFATE Mohammed A. Loutfy, Mahmoud M.A. Hassan, and Farid]. Muhtadi 1. Description
1.1 Nomenclature
2.
3.
4.
5. 6. 7. 8. 9.
1.2 Formulae 1.3 Molecular Weight 1.4 Elemental Composition 1.5 Appearance, Color, Odor, and Taste Physical Properties 2.1 Melting Range 2.2 Eutectic Temperature 2.3 Solubility 2.4 Dissociation Constant 2.5 Specific Rotation 2.6 Loss on Drying 2.7 pHRange 2.8 Spectral Properties Preparation of Quinidine Sulfate 3.1 Isolation of Quinidine 3.2 Quinidine Sulfate Synthesisof Quinidine 4. I Partial Synthesis 4.2 Total Synthesis Biosynthesis of Quinidine Metabolism Phannacokinetics Routes of Administration, Dosage, and Preparations Methods of Analysis 9.1 Identification 9.2 Gravimetric Method 9.3 Titrimetric Methods 9.4 Chromatography 9.5 Spectrophotometry References
ANALYTICAL PROFILES OF DRUG SUBSTANCES VOLUME I2
483
484 484 484 489 489 489 489 489 489 489 489 490 490 490 490 50 1 50 1 503 503 503 503 512 515 516 517 518 518 5 19 5 19 523 531 536
Copyrightby the American Phamcevrical Association.
ISBN 0-12-260812-7
MOHAMMED A. LOUTFY ETAL..
484
1. Description 1.1. Nomenclature 1.1.1 Chemical Names
Cinchonan-9-01, 6' -methoxy, (9s)sulfate (2:l) (salt), dihydrate.
,
(8s, gS)-6'-methoxy cinchonan-9-01, sulfate (2:l) (salt), dihydrate. a - ( 6-methoxy-4-quinolyl)-5-vinyl-2-
quinuclidine methanol , sulfate (2:l) salt, dihydrate.
6-methoxy-a- (5-vinyl-2-quinuclidinyl) -4-quinolinemethanol , sulfate (2:l) salt, dihydrate. ( S ) - CL -(6-methoxy-quinolin-4-yl)-a [ (2R,4S,5R)-( 5-vinylquinuclidin-2-yl)lmethanol, sulfate (2:l) salt , dihy-
drate.
1.1.2 Generic Names Quinidine sulfate; Quinidine sulfate (2:l) ( salt ) dihydrate. 1.1.3
Trade Names Quinidex; Quinicardine; Quinora; Kiditard; Kinidin; Cin-Quin.
1.2. Formulae 1.2.1 Fmpirical
(C H N 0 ) H2S04 2H20 20 24 2 2 2'
C40H54N4010S
QUINIDINE SULFATE
1.2.2 Structural
1.2.3 CAS registry number [ 6591-63-51 Quinidine sulfate (dihydrate)
[ 50-54-41 Quinidine sulfate ( anhydrous )
1.2.4 Wiswesser Line Notation T66 BNJ H O l E YQ-DT66
A B CNTJ AlUl & GH QH & H2-S-04 DX
&
(1)
MOHAMMED A. LOUTFY E T A .
486 1.2.5
Stereochemistry The stereochemistry of quinidine and o t h e r r e l a t e d a l k a l o i d s i s w e l l summarised by F i n a r ( 2 ) and Turner and Woodward ( 3 ) . I f Q r e p r e s e n t s t h e quinoline h a l f , t h e s t r u c t u r e of quinidine may be w r i t t e n a s follows:-
The above formula c o n t a i n s f i v e c h i r a l c e n t e r s : 1 , 3 , 4 , 8 and 9. Since t h e bridge must be a c i s f u s i o n , c e n t e r s 1 and 4 behave as "one c h i r a l u n i t " , t h e r e f o r e , t h e number of o p t i c a l l y a c t i v e forms would be t h e same a s obtained from f o u r c h i r a l c e n t e r s . When t h e 1-8 bond i s broken, t h e c h i r a l i t y of t h e n i t r o g e n is l o s t . Quinine, q u i n i d i n e , cinchonine and cinchonidine give on degradation t h e o p t i c a l l y i d e n t i c a l 8-oximino-3-vinylq u i n u c l i d i n e , meroquinene and cincholoiponic acid. It t h e r e f o r e follows t h a t t h e c o n f i g u r a t i o n s of C3 and C 4 a r e t h e same f o r a l l t h r e e compounds. Conclusive evidence f o r t h e c i s arrangement a t C3 and C 4 w a s provided by Prelog and Zalan ( 4 ) . They reduced cinchonine t o dihydrocinchonine and converted t h e product i n t o cinchlopoin e t h y l e s t e r i n which C 3 and C4 r e t a i n t h e o r i g i n a l c o n f i g u r a t i o n of cinchonine. The l a t t e r w a s converted i n t o t h e dibromide which,by means of a s e r i e s of r e a c t i o n s , a l l of which proceeded under mild c o n d i t i o n s and d i d not involve t h e c h i r a l c e n t e r s , w a s converted i n t o 1,2diethylcyclohexane [l]. This w a s shown
487
QUINIDINE SULFATE
t o be o p t i c a l l y i n a c t i v e (it could not be resolved). C2H5
I
[13
The o p t i c a l r e s u l t s provide conclusive evidence f o r a c i s arrangement of t h e two e t h y l groups i n t h e diethyl-cyclohexane [1] and s i n c e none of t h e s t e p s employed i n t h e conversion of cinchonine t o [l]involves t h e c h i r a l c e n t e r s a t C3 and C4, t h e v i n y l group of t h e n a t u r a l cinchona bases must be c i s t o t h e C7-c8 bond i n all a l k a l o i d s . The 9-deoxy d e r i v a t i v e s ( l : e , CH2 has replaced CHOH) of cinchonine and cinchonidine have d i f f e r e n t s p e c i f i c r o t a t i o n s , a t + 179.3' and - 29.9', respectively. Since t h e c o n f i g u r a t i o n s of C3 and C4 a r e t h e same i n both bases and s i n c e C9 i s no l o n g e r o p t i c a l l y a c t i v e , t h e d i f f e r e n c e between t h e two must be a t C8, and t h i s i s t h e r e f o r e a l s o t h e case for cinchonine and cinchonidine. ~ deoxyquinine i s S i m i l a r l y s i n c e [ a ] of 97.7' and t h a t of deoxyquinidine i s + 211.1', t h e n quinine and q u i n i d i n e d i f f e r a t Cg. The assignment of c o n f i g u r a t i o n s a t C8 may be deduced from t h e f a c t t h a t quinidine and cinchonine a r e both d e x t r o r o t a t o r y and both can be converted i n t o t h e i r c y c l i c e t h e r s [2]. On t h e o t h e r handyquinine and cinchonidine a r e both l e v o r o t a t o r y and do not form c y c l i c ethers.
MOHAMMED A. LOUTFY ETAL.
488
The c y c l i c e t h e r s t r u c t u r e i s only p o s s i b l e i f t h e group a t t a c h e d t o C3 and C8 a r e i n t h e endo-position [ 31. Thus i n cinchonine and q u i n i d i n e , t h e hydrogen atoms a t C3 and C8 a r e c i s with r e s p e c t t o each o t h e r . Also because c4 and c8 a r e c i s - o r i e n t e d , it follows t h a t t h e hydrogen atoms a t C3, C4 and c8 a r e a l l c i s - o r i e n t e d i n cinchonine and quinidine whereas i n cinchonidine and quinine t h e hydrogens a t C3 and C 4 are c i s , but t h e hydrogen a t C3 and c8 a r e t r a n s . For each c o n f i g u r a t i o n a t C8, two isomers a r e p o s s i b l e which d i f f e r i n o r i e n t a t i o n a t Cg. Since a l l a l k a l o i d s a r e i d e n t i c a l i n c o n f i g u r a t i o n except at c8 and Cg, f o u r isomeric substances are p o s s i b l e i n each s e r i e s . For example, two of t h e s e substances a r e presented by quinine and quinidine , t h e o t h e r two members are epiquinine and e p i members a r e quinidine. The o t h e r cinchonine, cinchonidine, epicinchonine and epicinchonidine. '
I n most r e s p e c t quinine and quinidine p a r a l l e l one another c l o s e l y i n t h e i r chemical behavior and d i f f e r q u a l i t a t i v e l y from t h e isomeric p a i r , epiquinine and e p i q u i n i d i n e . Since quinine and quinidine d i f f e r i n configurat i o n a t c8, t h e s e f a c t s suggest t h a t t h e two alkaloids d i f f e r a l s o i n configuration at Cg. I f t h e s e c o n f i g u r a t i o n s a r e accepted, then t h e r e l a t i v e c o n f i g u r a t i o n s a t C3, C4, C8 and Cg a r e now known. It i s now p o s s i b l e t o w r i t e t h e a b s o l u t e c o n f i g u r a t i o n s of quinine and quinidine. Other s t u d i e s showed t h a t both a l k a l o i d s are of t h e e r y t h r o conf i g u r a t i o n ( 5 ).
) quinine
( + ) quinidine
QUINIDINE SULFATE
489
1.3. Molecular Weight
782.95 (dihydrate) 746.92 ( anhydrous)
1.4.
Elemental Composition C , 61.36%; H, 6.95%; N , 7.16%, 0, 20.44%; S, 4.09% (dihydrate)
C, 64.32%; H, 6.75%; N, 7.50% 0, 17.14%; S, 4.29% (anhydrous)
1.5.
Appearance, Color, Odor and Taste Fine, needle-like white crystals, frequently cohering in masses, odorless, has a very bitter taste, darkens on exposure to light.
2.
Physica1 Properties.
2.1. Melting Range 205
-
(6)
2100
216'
by hot bar method
2.2. Eutectic Temperature
(6)
Sal. Dic.
161O
147"
(Both by hot stage method)
Sal.
164' 147'
(Both by hot bar method)
Dic.
Sal = acetaminosalol 2.3.
Dic = dicyandiamide
Solubility
1 g is dissolved in about 100 ml water, 10 ml. alcohol, in 3.0 ml methanol, in 5.0 ml boiling water and in 15 m l chloroform, insoluble in ether.
2.4.
Dissociation Constant Quinidine sulfate has two pKa values, the quinoline nitrogen at 20' is 5.4, whereas the pKa value of the quinuclidine nitrogen at 20' is 10 (7). pKa values : 4.2, 8.8 at 25' (8).
MOHAMMED A . LOUTFY ETAL.
490
2.5.
Specific Rotation
+
[ a ID2'' [a
275' t o
about
+
+
(3%w / v i n 0 . 1 M hydrochloric a c i d ) ( 9 )
( i n 95% e t h a n o l ) ( 1 )
212'
[ a I D + 184.17'
290'
(CHC13)
(10)
The s p e c i f i c r o t a t i o n was determined a s 1 mg/l m l e t h a n o l u s i n g a P e r k i n E l m e r 25 Polarmatic model 241 MC and found [ c1 I D + 215.5 2.6.
Loss on d r y i n g When d r i e d t o c o n s t a n t weight a t 130' l o s e s n o t l e s s t h a n 3.0% and n o t more t h a n 5.0% of i t s weight ( 8 ) .
2.7.
pH range w/v aqueous q u i n i d i n e s u l f a t e The pH of 1% s o l u t i o n i s 6 . 0 t o 6.8 ( 9 ) .
2.8.
Spectral Properties 2.8.1
U l t r a v i o l e t . Spectrum The W spectrum o f q u i n i d i n e s u l f a t e i n e t h a n o l ( F i g . 1) w a s scanned from 200 t o 400 nm u s i n g DMS 90 Varian Spectrophotometer. It e x h i b i t e d t h e f o l l o w i n g W d a t a (Table 1). Table 1 UV c h a r a c t e r i s t i c s of q u i n i d i n e
sulfate
231
E -
273
31320
317.5 331
5089.5
X max. a t nm 205 5
5481
Other r e p o r t e d W s p e c t r a l d a t a for q u i n i d i n e s u l f a t e i n methanol (1):Amax. a t 208 nm, 236 nm (34900), 280 nm (3740) and 334 nm ( 5 8 7 0 ) .
QUINIDINE SULFATE
F i g u r e 1. The W Spectrum o f Q u i n i d i n e S u l f a t e i n Ethanol
0.
491
MOHAMMED A. LOUTFY ETAL.
492
and f o r q u i n i d i n e i n e t h a n o l (11):Amax. a t 236 nm ( E 1%, 1 cm 1110), 278 nm ( E 1%, 1 cm 1 3 2 ) and 332 nm ( E l%, 1 cm 163). 2.8.2
I n f , r a r e d Spectrum The I R spectrum of q u i n i d i n e s u l f a t e as KBrd i s c w a s recorded on a P e r k i n Elmer 580 B I n f r a r e d Spectrophotometer t o which I n f r a r e d Data S t a t i o n i s a t t a c h e d ( F i g . 2 ) . The s t r u c t u r a l assignments have been c o r r e l a t e d w i t h t h e f o l l o w i n g f r e q u e n c i e s (Table 2 ) . Table 2. sulfate
I R c h a r a c t e r i s t i c s of q u i n i d i n e
-1 Frequency ,cm
As si gnment
3340
OH bonded
2300
NH+( q u i n u c l i d i n e )
2950
CH s t r e t c h
1620
CN
[ C=C ( a l k e n e ) (aromatic)
1600,1510,1475
C=C
1245,1230,1100 ,1050 860,835,800,720
e t h e r linkage T r i s u b s t i t u t e d benzene
The I R e x h i b i t e d t h e f o l l o w i n g o t h e r c h a r a c t e r i s t i c bands:
1435, 1360, 1310, 1150, and 610 cm-l.
940, 920, 765, 625
Other I R d a t a f o r q u i n i d i n e s u l f a t e (1)and f o r q u i n i d i n e (11)have been a l s o r e p o r t e d . Hayden and Sammul ( 1 2 ) d e s c r i b e d t h e I R s p e c t r a of dimorphous and amorphous forms of q u i n i d i n e . 2.8.3
Nuclear Magnetic Resonance S p e c t r a 2.8.3.1
Proton S p e c t r a The PMR s p e c t r a of b o t h q u i n i d i n e s u l f a t e i n DMSO D6 and q u i n i d i n e i n C D C l 3 were r e c o r d e d on a Varian
QUINIDINE SULFATE
493
T - ~ O A , 60 MHz NMR Spectrometer u s i n g TMS ( T e t r a m e t h y l s i l a n e ) as an i n t e r n a l r e f e r e n c e . These are shown i n F i g . 3 and Fig. 4 r e s p e c t i v e l y .
The f o l l o w i n g s t r u c t u r a l assignments have been made (Table 3).
Table
Group
2H
3H
5H 7-H, 8-H vinylic
0-CH3 quinuclidine
s = s i n g l e t , d=doublet q = q u a r t e t , m= m u l t i p l e t bs=broad s i n g l e t , b d =broad doublet. Other PMR d a t a of q u i n i d i n e have been r e p o r t e d (1).
I
,
,
I
1
'
1
1
,
I
1
500
I .
-
. *
1 . . . . 1 -
.
I
.
1
400
I
...
....
* I
1 .
- ..
1
...
.
iI
.
I
l " " I " " 1 '
I
.
I
.
iw
I
lk
1
1 . . . . 1 . . . . 1 . . . . 1 . . . . l . * . . ~ ,
FIG. 3 MhR SPECTRUM OF Q U I N I D I N E SULFATE I N OMSO Dg
'
I
500
b
FIG. 4 KHR SPECTRUM OF QUINIDINE
IN
CDCL~
MOHAMMED A. LOUTFY E T A .
496
2.8.3.2
13C-NMR The l3C-NMR n o l s e decoupled and o f f resonance s p e c t r a are p r e s e n t e d i n F i g . 5 and Fig. 6 r e s p e c t i v e l y . Both were r e c o r d e d over 5000 Hz width i n DMSO D6 ( c o n c e n t r a t i o n 72.4 mg/l m l ) on J o e l FX-100 NMR Spectrometer, u s i n g a 1 0 mm sample t u b e and TMS as a r e f e r e n c e s t a n d a r d a t 20’. The carbon chemical s h i f t s a r e a s s i g n e d on t h e b a s i s o f t h e a d d i t i v i t y p r i n c i p a l s and t h e o f f resonance s p l i t t i n g p a t t e r n ( T a b l e 4).
Table
Carbon no.
‘6
c3 C
9
‘18 ‘8
4.
Carbon Chemical S h i f t s of Quinidine Sulfate
Chemical s h i f t [ PPm 1
Carbon no. Chemical s h i f t PPml
157.50(s )
c4
125.82( s )
147.17 ( d)
C
121.53( d )
145.90( s )
C
143.56( s )
c2
115.98(d)
139.40(d)
C
101.94(d )
130*99(d)
5 0
7 19
5
118.71(t)
66.86( a )
497
QUINIDINE SULFATE
Figure 5. The 13C-NMR Noise Decoupled Spectrum of Quinidine Sulfate
I
Figure 6. The 13C-NMR O f f Resonance Spectrum of Quinidine Sulfate
MOHAMMED A. LOUTFY ETAL.
498
Carbon no.
Chemical s h i f t [.PPml
51
58.97(d)
'16
56.33(t 1
'17 '13
48.34 ( 9 )
c20 C
Carbon no.
47.56(t)
15
Chemical s h i f t PPml 37.72 (d) 26.99 ( d ) 23.19(t)
'14
18.22(t)
s = s i n g l e t , d=doublet , t e r i p l e t , q = q u a r t e t
.
Other 13C-NMR d a t a f o r q u i n i d i n e ( 1 3 , 1 4 ) , q u i n i d i n e maleate ( 1 3 ) , e p i q u i n i d i n e (14 ) and dihydroquinidine (14) have a l s o been r e p o r t e d . 2.8.4
Mass Spectrum The mass spectrum of q u i n i n e h y d r o c h l o r i d e o b t a i n e d by e l e c t r o n impact i o n i z a t i o n which w a s recorded on a Finnigan Model 3000 D GC-MS-system. The spectrum scanned t o mass 500 w i t h u n i t r e s o l u t i o n . E l e c t r o n energy w a s 7Oev. The chemical i o n i z a t i o n mass s p e c t r a l d a t a were o b t a i n e d on a Finnigan Model l O l 5 D GC Mass Spectrometer. Methane w a s used as GC c a r r i e r gas and a l s o served as t h e C I r e a c t a n t g a s i n t h e i o n source. The i o n s o u r c e t e m p e r a t u r e was 1 8 0 O c and e l e c t r o n energy 100 ev., i o n r e p e l l e r , 3V. E l e c t r o n impact mass s p e c t r a l d a t a i s pres e n t e d i n Fig. 7 ( 1 5 ~ 6 ) Base Peak 136 42, 55, 67, 81, 95, 117, 122, 136, 158, 173, 174, 189, 214, 226, 240, 253, 269, 283, 295, 309, M'324 The fragmentation p a t t e r n is p r e s e n t e d below
(16) C I mass s p e c t r a l d a t a and prominent fragment i o n s are ( 1 5 )
M.H+ 325(100), 3 0 7 ( 1 2 ) , 1 3 6 W , 2 9 5 ( 4 ) , 323(4)*
M
0
0 u)
'?in z
r-
t
7 tn
MOHAMMED A. LOUTFY ETAL.
500
H3CO
q u i n i d i n e m / e 324
QUINIDINE SULFATE
3.
501
P r e p a r a t i o n of q u i n i d i n e s u l f a t e Quinidine i s t h e dextrorotatory diastereoisomer of q u i n i n e which i s o b t a i n e d from v a r i o u s s p e c i e s of cinchona or t h e i r h y b r i d s and from Remijia pendunculata a l l of t h e f a m i l y Rubiaceae. It i s found i n cinchona b a r k s t o t h e e x t e n t of 0.25-3.0% (7,17,18 ) .
3.1.
I s o l a t i o n of q u i n i d i n e S e v e r a l methods have been r e p o r t e d f o r t h e i s o l a t i o n o f q u i n i d i n e from cinchona b a r k , t.he most important method i s as follows ( 19):Powdered cinchona (25Og) i s w e l l mixed w i t h C a O ( 6 0 g ) , water (600 m l ) and 30% NaOH s o l u t i o n (301111) and l e f t f o r 24 hours. The mixture i s t h e n exhaust i v e l y e x t r a c t e d under r e f l u x w i t h benzene. The benzene e x t r a c t i s f i l t e r e d w h i l e hot i n t o a separating funnel containing concentrated H SO 2. 4 ( 7 g ) i n water (500 m l ) t o convert t h e a l k a l o i d s t o t h e i r b i s u l f a t e s a l t s . The mixture i s s e p a r a t e d and t h e a c i d aqueous l a y e r i s h e a t e d t o 90' and n e u t r a l i s e d w i t h 5% Na2C03 s o l u t i o n u s i n g l i t m u s as an i n d i c a t o r (The b i s u l f a t e s a l t s a r e now converted i n t o t h e s u l f a t e s a l t s ) . The c l e a r orange s o l u t i o n becomes t u r b i d due t o t h e separat i o n of some r e s i n o u s m a t e r i a l . D i l u t e H2S04 ( 2 d r o p s ) and animal c h a r c o a l ( 2 g ) a r e added and t h e r e s u l t i n g mixture i s h e a t e d a g a i n a t 90' f o r 1 5 minutes and f i l t e r e d . The f i l t e r a t e i s allowed t o cool down when q u i n i n e s u l f a t e s e p a r a t e s o u t and c o l l e c t e d by f i l t e r a t i o n , The c o l d f i l t e r a t e i s rendered a l k a l i n e w i t h NaOH s o l u t i o n and shaken s u c c e s s i v e l y w i t h e t h e r . The e t h e r e x t r a c t which c o n t a i n s q u i n i d i n e and c i n c h o n i d i n e i s evaporated t o dryness and t h e r c s i d u e i s d i s s o l v e d i n d i l u t e h y d r o c h l o r i c a c i d . Few drops of haematoxylin i n d i c a t o r are added and t h e r e s u l t i n g m i x t u r e i s n e u t r a l i z e d w i t h ammonia s o l u t i o n t o f a i n t yellow c o l o r . Sodium potassium t a r t a r a t e ( R c c h e l l e s a l t ) i s now added and t h e mixture k e p t f o r a while upon which c i n c h o n i d i n e t a r t a r a t e i s p r e c i p i t a t e d and removed by f i l t e r a t i o n . The f i l t e r a t e c o n t a i n i n g soluble quinidine tartarate i s t r e a t e d with potassium i o d i d e s o l u t i o n where q u i n i d i n e hydrogen i o d i d e i s p r e c i p i t a t e d , c o l l e c t e d and decomposed w i t h ammonia when f r e e q u i n i d i n e p r e c i p i t a t e s o u t . Schematic method f o r t h e i s o l a t i o n of major c i n chona a l k a l o i d s i s p r e s e n t e d i n F i g . 8.
MOHAMMED A. LOUTFY ETAL.
502
Powder cinchona + C a O + NaOH + Water r e f l u x with benzene
J7
hot f i l t r a t e e x t r a c t with d i l . H2S04
4
Alkaloids b i s u l f a t e
Alkaloids s u l f a t e , b o i l with charcoal
4
Cool f i l t r a t e
1
1 filtrate
Quinidine, Cinchonine, Cinchonidine Add NaOH and e x t r a c t with e t h e r
I
.c
aqueous Cinchonine evaporate t o dryness e x t r a c t with alcoholt decolorise with charcoal and leave t o c r y s t a l l i s e
sulfate
+
Add b o i l i n g water+Na2C03
4
Q.uinine
ether Quinidine, Cinchonidine e x t r a c t with d i l . H C 1
I
neutralize acid solution, add Na k tartarate
Cinchonine
I
PA
(Cinchonidine t a r t . ) Add H C 1 Alkaloid H C 1 + NH40H
1
Cinchonidine
4
filtrate (Quinidine t a r t . ) Ada IU
1
ppt. (Quinidine H 1 ) Add + NHhOH
J
Quinidine
Fig.8 Schematic Method for t h e Isolation of Cinchona Alkaloids.
QUINIDINE SULFATE
3.2.
503
Quinidine s u l f a t e Q u i n i d i n e s u l f a t e i s o b t a i n e d by n e u t r a l i z i n g t h e a l k a l o i d q u i n i d i n e w i t h d i l u t e s u l f u r i c a c i d and r e c r y s t a l l i s i n g from b o i l i n g water t o g i v e f i n e n e e d l e l i k e c r y s t a l s of q u i n i d i n e s u l f a t e ( 2 0 ).
4.
S y n t h e s i s of Q u i n i d i n e
4.1. P a r t i a l S y n t h e s i s Rabe and Kindler i n 1918 ( 2 1 ) achieved t h e f i r s t p a r t i a l s y n t h e s i s of q u i n i n e and q u i n i d i n e from quinotoxine
.
Quinotoxine w a s converted by t h e a c t i o n of sodium hypobromite i n t o N-bromoquinotoxine which w a s c y c l i z e d by a l k a l i w i t h t h e l o s s of hydrogen bromide t o g i v e quininone. Reduction of t h e k e t o n e w i t h aluminium powder and e t h a n o l i n t h e p r e s e n c e o f e t h o x i d e gave a mixture of s t e r e o i s o m e r i c a l c o h o l s from which q u i n i n e and q u i n i d i n e were i s o l a t e d . G u t z w i l l e r and Uskokovic i n 1973 ( 2 2 ) developed a s l i g h t l y d i f f e r e n t scheme f o r t h e p a r t i a l synthe s i s of q u i n i n e and q u i n i d i n e from quinotoxine. Q u i n i t o x i n e w a s d i s s o l v e d i n dichloromethane and t r e a t e d w i t h sodium h y p o c h l o r i t e s o l u t i o n t o g i v e N-chloroquinotoxine. This was c y c l i z e d w i t h phosp h o r i c a c i d t o g i v e a mixture of q u i n h o n e and quinidinone. The r e s u l t i n g m i x t u r e was d i s s o l v e d i n benzene and t r e a t e d with a s o l u t i o n of d i i s o butylaluminium h y d r i d e i n t o l u e n e t o g i v e a mixtu.re of q u i n i n e and q u i n i d i n e which w a s s e p a r a t e d by crystallization. Q u i n i d i n e can a l s o be prepared by p a r t i a l racemizat i o n of q u i n i n e ( 2 3 ) . Q u i n i n e i s t r e a t e d w i t h a meta.lic a l k o x i d e where p a r t i a l r a c e m i z a t i o n o c c u r s t o give quinidine. 4.2.
Total Synthesis S e v e r a l methods f o r t h e t o t a l s y n t h e s i s o f q u i n i d i n e have been r e p o r t e d @+-29,22).Two of t h e s e methods are p r e s e n t e d i n scheme 1 and 2. Other methods are i n c l u d e d i n q u i n i n e hydrochl o r i d e ( 30).
504
MOHAMMED A. LOUTFY ETAL.
Method I Total Synthesis according to Uskokovic -25,26). N-benzoylhexahydroisoquinolone [ 11 is hydrogenated with rhodium on alumina catalyst to give predominantly cis-isoquinolone [ 21 which is treated with sodium azide in poly-phosphoric acid to give a mixture of the seven-membered lactams which is separated by fractional crystallisation to give [ 31. Lactam [3] is treated with dinitrogen tetroxide to give the N-nitrosolactam [4] which is rearranged upon heating to the diazolactone [5] and fragmented with extrusion of nitrogen to give a mixture of racemic N-benzoylmeroquinene [ 61 and the seven membered lactone [gal (in 50 and 30% yield, respectively). The latter [?a] can be converted into [6] which upon esterification gives N-benzoylmeroquinene methyl ester [6al. This ester is treated with 6-methoxylepidyllithium [ 71 in tetrahydrofuran to give the racemic N-benzoylketone [ 8 ] . This is treated with diisobutylaluminium hydride in toluene at - 78' [route a] to remove the benzoyl group with concomitant reduction of the ketone function to give the aminoalcohol [9]. The aminoalcohol [ 91 is first acetylated with acetic acid containing 10% boron trifluoride etherate and treated with boiling benzene - acetic acid - sodium acetate where cyclization proceeds to give a mixture of desoxyquinine and desoxyquinidine [ 1 2 ] . This can also be achieved without acetylation. The aminoalcohol [9] is refluxed with benzene - acetic acid mixture ( 4 : 1 ) for 4-5 days when cyclization proceeds via dehydration [ 113 to give both desoxyquinine and desoxyquinidine [121.
Upon stirring a solution of [12] in dimethylsulfoxide-t-butylalcohol ( 4 : l ) containing potassium t-butoxide in an atmosphere of oxygen affords a mixture of quinine [13] and quinidine [ 1 4 ] . Separation can be effected by a combination of crystallization and chromatography.
An alternative synthetic route [b] via the amino epoxide [lo] is as follows:N-benzoylketone [8] is converted into a mixture of diastereomeric N-benzoyl epoxides [ 10a] by bromination followed by sodium borohydride
QUINIDINE SULFATE
Scheme 1: Total Synthesis of Quinidine (Method I)
505
506
MOHAMMED A. LOUTFY E T A .
-
QUINIDINE SULFATE
[91
[a1
Acetylation
507
MOHAMMED A . LOUTFY ETAL.
reduction. Reductive debenzoylation of [loa] with diisobutylaluminium hydride in toluene at - 78' furnished a mixture of diastereomeric aminoepoxides [ 101. Treatment of [ 103 with tolueneethanol (19:l) at reflux for 12 hr. give quinine [13] and quinidine [14]. Separation is effected by preparative thin layer chromatography. Method I1
Total Synthesis of Quinidine ( 29,22)
3-[ 3(R)-ethyl-4(R)-piperidyl]-propionic acid ethyl ester [l] is N-chlorinated with N-chlorosuccinimide in a two phase system (waterlether) to give N-chloramine [2]. This is in trifluoroacetic acid is subjected to photolysis by a 200 W Hanovia medium pressure mercury lamp below 15' to give 3-[3(R)-( 2-~hloroethyl)-b(R)-piperidyl]propionic acid ethylester [3]. Compound [3] is condensed with benzoyl chloride [4] to give the condensate 3-[ l-Benzoyl-3(R)-( 2-chloroethy1)4(R)-piperidyll-propionic acid ethylester [ 51. Compound [ 5 ] is saponified to give 3-[ 1-benzoyl-3 ( R ) - ( 2-chlorethyl)-b (R ) -piperidyl]-propionic acid [6]. Dehydrochlorination of compound [6] with potassium t-butoxide in DMSO gives N-benzoylhomomeroquinene [ 7 ] which is esterified to give N-benzoyl-homomeroquinene ethylester [ 81. Compound [8]can be proceeded to quinotoxine via two routes. Route [a] Claisen condensation of [8]with ethyl quininate [9] to give the 6-keto ester [lo] which by hydrolysis and decarboxylation gives quinotoxine [ 111. Route [b] Condensation of [8]with 6-methoxy4-quinolyllithium [ 121 affords N-benzoylquinotoxine [ 131 which upon hydrolysis yields quinotoxine [ 111. Quinotoxine [ll] is dissolved in dichloromethane and treated with sodium hypochlorite solution to give N-chlorotoxine [14]. This is cyclized by treatment with phosphoric acid to give a mixture (1:l) of quininone [15] and quinidinone [16]. The resulting mixture is dissolved in benzene and reduced with diisobutylaluminium hydride (DIBAL-H) to give a mixture of quinine [17] and quinidine [18] which is separated by crystallization.
509
QUINIDINE SULFATE
Scheme 2:
Total Synthesis of Quinidine (Method 11)
I
COOC2H5
COOC2Hg
I
COOC2H5
&
c1
H
[31
+
C 00 C 2 H 5
2
COCl
[41
c6H5
0
c6H5
0
[6 1
0
C6H5
510
MOHAMMED A. LOUTFY E T A .
QUINIDINE SULFATE
511
R
R
I I
C151
H
R=OCH3
MOHAMMED A. LOUTFY ETAL.
512
5.
Biosynthesis of Quinidine Postulation of the biosynthetic pathway of cinchona alkaloids started in 1950 with the suggestion o f Goutarel et al. ( 31) that cinchona alkaloids are derived from indolic precursors since cinchonamine (indole alkaloid) occurs as a minor alkaloid in cinchona. This w a s proved when Kowanko and Leete (32) have isolated labelled quinine upon feeding try~tophan-2-~~C into cinchona plants. They have shown that the quinoline ring and Cg unit of quinine originated from tryptophan. Further studies have proved that quinine is biosynthesized by a combination of indolic and monoterpenoid units which leads to the corynanthe type indole alkaloids. Thus tryptophan (32) geraniol (33-35) and loganin (36 ) were incorporated into quinine. Tracer experiments on Cinchona ledgeriana carried out by Battersby and. Parry ( 37) have established the biosynthetic pathway of quinine and quinidine as presented in scheme 111. Scheme 111: Biosynthesis of quinine and quinidine.
QUINIDINE SULFATE
513
__T
corynantheal
I
H
I
H I
A
514
MOHAMMED A. LOUTFY ETAL.
Quininone 0
Quinidinone
H
Quinine L. I
H?CO
Quinidine
515
QUINIDINE SULFATE
6. Metabolism The metabolism of quinidine has been extensively studied in human and rat urines. The metabolic products of quinidine found in man are:-
(3s)-3-hydroxyquinidine (13,16,38) $-quinidinone (13,16) O-desmethylquinidine (39,40), and quinidine-N-oxide ( 41,421. 
Brodie et al. (43) reported the presence of monohydroxynon-phenolic metabolite of quinidine, quinidine carbostyril and dihydroxy non-phenolic metabolite of quinidine. Palmer et al. (16)have suggested the existence of other unidentified hydroxylated metabolites as well as conjugated compounds. Barrow et al. (44) have separated nine metabolites of quinidine (Fig. 11) in the urine of male Sprague-Dawley rats after a single dose of quinidine ( 5 0 mg/Kg). Five of these metabolites have been identified as: O-desmethylquinidine, 3-hydroxyquinidine, unchanged quinidine and the two diastereoisomers of quinidine10, ll-dihydrodiols. They concluded that the urinary profiles of the rat and man are different. 2'-Quinidinone, a major metabolite in man was not detected in the rat and the two diastereoisomers of quinidine 10, 11dihydrodiols were only reported in the rat urine (44). The major metabolites in man are:-
( 3s )-3-hydroxyquinidine
MOHAMMED A. LOUTFY ETAL.
516
Ho\ H
H
HO
0
2-quinidinone
7.
0-Desmethylquinidine
Pharmacokinetics When a d m i n i s t e r e d o r a l l y , q u i n i d i n e s u l f a t e i s absorbed r a p i d l y and peak c o n c e n t r a t i o n s i n plasma are a t t a i n e d i n 60 t o 90 minutes. The a b s o r p t i o n of q u i n i d i n e gluconate i s slower and maximal c o n c e n t r a t i o n s a r e not observed u n t i l 3 t o 4 hours a f t e r an o r a l dose ( 4 5 ) . Q u i n i d i n e accumulates r a p i d l y i n most t i s s u e s except b r a i n , and t h e apparent volume of d i s t r i b u t i o n i s 2 t o 3 l i t e r s p e r kilogram ( 4 5 ) . Following o r a l a d m i n i s t r a t i o n , t h e a b s o l u t e b i o a v a i l a b i l i t y of q u i n i d i n e i s about 70% o f t h e i n g e s t e d dose b u t may v a r y widely between p a t i e n t s
(46,47,48). Plasma q u i n i d i n e c o n c e n t r a t i o n s are g e n e r a l l y h i g h e r and appear e a r l i e r when t h e drug i s a d m i n i s t e r e d on an empty stomach (49,50). About 70 t o 80% of q u i n i d i n e i n plasma i s bound t o plasma albumin. The drug e n t e r s e r y t h r o c y t e s and a p p a r e n t l y b i n d s t o hemoglobin; a t a s t e a d y s t a t e c o n c e n t r a t i o n s of q u i n i d i n e i n plasma and e r y t h r o c y t e s are approximately e q u a l s ( 5 1 ) . Q u i n i d i n e i s metabolized by t h e l i v e r and e x c r e t e d i n t h e u r i n e . The mean v a l u e f o r t h e e l i m i n a t i o n h a l f - l i f e Ochs e t a l . of q u i n i d i n e i s 6 t o 7 hours (45,52-54). ( 5 4 ) have r e p o r t e d t h a t t h e e l i m i n a t i o n h a l f - l i f e of q u i n i d i n e i s g r e a t e r i n t h e e l d e r l y persons ( o v e r 60 y e a r s ) when compared t o t h e younger p e r s o n s (less t h a n 35 y e a r s ) . T o t a l body q u i n i d i n e c l e a r a n c e i s about 4.5 ml/min/Kg w i t h wide p a t i e n t t o p a t i e n t v a r i a t i o n s (48, 53).
517
QUINIDINE SULFATE
Since q u i n i d i n e i s a weak b a s e , e x c r e t i o n i s enhanced i f t h e u r i n e i s a c i d i c . When t h e u r i n a r y pH i s i n c r e a s e d from t h e 6-7 range t o t h e 7-8 r a n g e , r e n a l c l e a r a n c e of q u i n i d i n e d e c r e a s e s as much a s 50% and c o n c e n t r a t i o n i n t h e plasma i n c r e a s e s ( 5 5 ) .
8. Routes of A d m i n i s t r a t i o n , Dosage and P r e p a r a t i o n s Q u i n i d i n e i s u s u a l l y given o r a l l y , although it can be administered e i t h e r intramuscularly o r intravenously under s p e c i a l circumstances. The u s u a l o r a l dose o f q u i n i d i n e s u l f a t e i s 300 t o 500 mg f o u r t i m e s a day. I n most p a t i e n t s q u i n i d i n e w i l l r e a c h a s t e a d y s t a . t e on such a schedule i n about 24 hours and i t s c o n c e n t r a t i o n i n plasma w i l l f l u c t u a t e l e s s t h a n 50% between doses ( 4 5 ) . Because of t h e l a r g e i n t e r i n d i v i d u a l v a r i a t i o n , d r u g i n t e r a c t i o n s , and o t h e r causes of v a r i a b i l i t y , it i s w i s e t o examine t h e ECG c a r e f u l l y a f t e r t h e i n i t i a l dose of q u i n i d i n e and t o measure t h e plasma c o n c e n t r a t i o n of t h e drug a t s t e a d y s t a t e . Adjustment o f dosage i s o f t e n necessary. I f an e f f e c t i v e concentrat i o n must be achieved r a p i d l y , a l o a d i n g dose of 6001000 mg can be given ( 4 5 ) . Q u i n i d i n e s u l f a t e , U.S.P., T a b l e t s and c a p s u l e s c o n t a i n 1 0 0 , 200 o r 300 mg of t h e drug. P r e p a r a t i o n s f o r slow a b s o r p t i o n a r e a l s o a v a i l a b l e , t h e s e i n c l u d e a 300-mg extended-release t a b l e t of q u i n i dine sulfate (Quinidex)
.
Q u i n i d i n e s u l f a t e i s a l s o a v a i l a b l e a s an i n j e c t i o n i n 1 m l a m p o u l s c o n t a i n i n g 200 mg/ml. The n e c e s s a r y dose i s d i l u t e d t o 800 mg/50 m l i n 5% glucose s o l u t i o n and i s i n j e c t e d i n t h e r a t e of 1 6 mg p e r minute, w i t h continuous o b s e r v a t i o n of t h e p a t i e n t and of t h e ECG. It i s import a n t t o record t h e a r t e r i a l pressure a t frequent i n t e r v a l s ( 45 1.
MOHAMMED A. LOUTFY ETAL.
518
9.
Methods of Analysis
9.1
Identification
9.1.1
Color Tests The following c o l o r t e s t s have been reported (8,11,56).
a. Thalleioquin t e s t : The a d d i t i o n of 2 drops of bromine s o l u t i o n t o 5 m l of a s a t u r a t e d s o l u t i o n of quinidine or quinine or a 1:lOOO s o l u t i o n of t h e i r s a l t s , followed by 1 ml of ammonia solut i o n produces an emerald-green c o l o r due t o t h e formation of t h a l l e i o q u i n . Quinidine and i t s diastereoisomer quinine a r e d i f f e r e n t i a t e d by ( i )t h e i r o p t i c a l r o t a t i o n s (quinidine i s dextrorotatory while quinine i s l e v o r o t a t o r y ) , and by ( i i )t h e i r behavior toward a l k a l i t a r t a r a t e (18). I n n e u t r a l or s l i g h t l y a c i d s o l u t i o n s quinine i s p r e c i p i t a t e d by a l k a l i t a r t a r a t e , while quinidine i s not. ( i i i )On t h e o t h e r hand, quinidine i n moderately d i l u t e s o l u t i o n i s p r e c i p i t a t e d by soluble iodides but quinine i s not a f f e c t e d (18). To a 0.5% w/v s o l u t i o n add an equal volume of M sulphuric a c i d ; an i n t e n s e blue fluorescence i s produced ( 9 ) . b.
c. A 1% s o l u t i o n gives a yellow but not a blue c o l o r with bromothymol blue ( 6 ) . To 5 m l o f a 1% s o l u t i o n add 1 m l of s i l v e r n i t r a t e s o l u t i o n and s t i r with a g l a s s rnd; a f t e r a s h o r t i n t e r v a l a white p r e c i p i t a t e , s o l u b l e i n n i t r i c a c i d , i s produced ( d i s t i n c t i o n from many o t h e r alkaloids ) ( 6) d.
.
e. Quinidine sulphate y i e l d s t h e react i o n s c h a r a c t e r i s t i c of sulphates. A study of color
changes of quinidine and o t h e r a l k a l o i d s , i n r e l a t i o n t o time has been described (57). The c o l o r t e s t s with concentrated sulphuric
519
QUINIDINE SULFATE
a c i d , Erdmann's , Froehde's, Mandelin's, and Marquis's r e a g e n t a p p l i e d t o a l a r g e number of a l k a l o i d s , i n c l u d i n g q u i n i d i n e , have been r e p o r t e d ( 5 7 ) . 9.1.2
Micro-Crystal Tests Photomicrographs o f t h e c r y s t a l s formed are i l l u s t r a t . e d i n Fig.9 (58). The following m i c r o - c r y s t a l t e s t s are a l s o useful i d e n t i f i c a t i o n tests: i ) Potassium i o d i d e s o l u t i o n g i v e s irregular crystals, often triangular ( s e n s i t i v i t y : 1 i n 3000) (11).
i i ) Sodium c a r b o n a t e s o l u t i o n produces dense r o s e t t e s , forming o v e r n i g h t ( s e n s i t i v i t y : 1 i n 1000) (11). iii) Dissolve t h e sample (1mg) i n water ( 2 ml), a c i d i f y w i t h d i l u t e s u l p h u r i c a c i d (1 d r o p ) and add a few drops o f an aqueous s o l u t i o n c o n t a i n i n g 5% o f cadmium i o d i d e and 10% o f potassium i o d i d e . Q u i n i n e g i v e s c o l o r l e s s c r y s t a l s and t h e s o l u t i o n becomes t u r b i d ; q u i n i d i n e g i v e s pale-yellow c r y s t a l s more s l o w l y , but t h e c o l o r change o f t h e s o l u t i o n i s e a s i l y d e t e c t e d . This r e a c t i o n h a s been u t i l i s e d f o r t h e d i s t i n c t i o n between q u i n i n e and q u i n i d i n e ( 5 9 ) .
9.2
Gravimetric Method Vignoli e t a l . ( 6 0 ) have d e s c r i b e d d e t e r m i n a t i o n o f a l k a l o i d c o n t e n t of cinchona powder by e x t r a c t i o n w i t h aqueous s o l u t i o n s of v a r y i n g pH. The extract w a s evaporated t o a sludge on a steam b a t h and t h e n oven-dried a t 95'. The d r y e x t r a c t was weighed and t h e a l k a l o i d c o n t e n t determined.
9.3
T i t r i m e t r i c Methods
9.3.1
Aqueous Schneider ( 6 1 ) h a s d e s c r i b e d t h e determinat i o n of some m i n e s a l t s , i n c l u d i n g quinid i n e s u l f a t e . The salt ( 0 . 1 g m ) i s d i s s o l v e d i n 90% e t h a n o l ( 1 0 m l ) , and t h e
MOHAMMED A. LOUTFY ETAL.
520
FIG, 9.
l ? I C R O C H E M I C A L C R Y S T A L S OF O U l N l D l N E
SULFATE
WITH
KI.
QUINIDINE SULFATE
521
s o l u t i o n is p a s s e d , a t 2 t o 3 m l p e r minute, through a n anion-exchange r e s i n . The combined p e r c o l a t e s are d i l u t e d w i t h d i s t i l l e d water and t h e l i b e r a t e d q u i n i d i n e i s t i t r a t e d w i t h 0 . 1 N HC1 u s i n g T a s h i r o ' s i n d i c a t o r , u n t i l t h e green-blue c o l o r changed t o v i o l e t ( 6 2 ) . Thomis and K o t i o n i s ( 6 3 ) have p u b l i s h e d t h e i n f l u e n c e of o r g a n i c b a s e s on t h e p a r t i t i o n o f i n d i c a t o r a c i d s (and v i c e v e r s a ) i n a water-chloroform system. T h i s a f f o r d s a method f o r t i t r a t i n g q u i n i d i n e and o t h e r b a s e s . A s o l u t i o n o f t h e sample ( 0 . 2 m l ) , mixed w i t h 2 ml of b u f f e r solut i o n (pH 5.5) and 15 m l of chloroform, i s t i t r a t e d w i t h 0.001 M bromothymol b l u e , vigorous shaking b e i n g a p p l i e d between a d d i t i o n s . The end p o i n t i s marked by a yellow c o l o r i n t h e aqueous l a y e r . This t i t r a t i o n i s used as a n approximate d e t e r mination. An a c c u r a t e d e t e r m i n a t i o n i s t h e n made by adding an excess of 0.0004M bromothymol b l u e t o t h e s o l u t i o n o f t h e b a s e , b u f f e r e d a t pH 7.5, e x t r a c t i n g w i t h chloroform and determining t h e bromothymol bl.ue i n t h e chloroform l a y e r by e x t r a c t i n g it w i t h aqueous sodium hydroxide and comparing t h e color of t h e a l k a l i n e e x t r a c t w i t h s t a n d a r d s . These p r i n c i p l e s are used i n t h e determination of a l k a l o i d s , includi n g q u i n i d i n e , and o t h e r b a s i c drugs i n some pharmaceutical p r e p a r a t i o n s .
9.3 2 Non-Aqueous Non-aqueous t i t r a t i o n s have been p u b l i s h e d f o r t h e q u a n t i t a t i o n of q u i n i d i n e a l k a l o i d and s a l t . The drug i s t i t r a t e d by perc h l o r i c a c i d i n a c e t i c a c i d and t h e endp o i n t i s determined p o t e n t i o m e t r i c a l l y . The method w a s used f o r t h e d e t e r m i n a t i o n of q u i n i d i n e s u l f a t e , u s i n g b r i l l i a n t green and F e t t b l a u B as i n d i c a t o r s ( 6 4 ) . Non-aqueous t i t r a t i o n o f s m a l l amount of a l k a l o i d i n t h e p r e s e n c e of a n a d s o r p t i o n e l e c t r o d e h a s been r e p o r t e d ( 6 5 ) .
MOHAMMED A. LOUTFY ETAL.
522
Determination of q u i n i d i n e , and o t h e r a l k a l o i d s , by means of t h e hydrochloric a c i d complex of chloroaluminium isopropoxide i n non-aqueous media, has been repin the o r t e d ( 6 6 ) . The d e v i a t i o n i s ? 1% range 38 t o 245 mg of t h e a l k a l o i d . 9.3.3
Complexometric Rolski e t a l . (67) have r e p o r t e d complexometric determination of a l k a l o i d s using copper p i c r a t e . The method i s based on t h e f a c t t h a t a l k a l o i d s give constant complexes w i t h c u p r i c p i c r a t e ; t h e i r compositions depend only on t h e t y p e of a l k a l o i d , These complexes were p r e c i p i t a t e d from 0.1 gm a l k a l o i d s o l u t i o n with 0.02 M c u p r i c p i c r a t e . The p r e c i p i t a t e w a s f i l t e r e d and washed, then 0.02 M sodium v e r s e n a t e , ammonium b u f f e r (pH 10.4) and murexide were added t o t h e f i l t r a t e . The excess versenate w a s t i t r a t e d with 0.02 M zinc s u l f a t e t o t h e green color. The method gave t h e error of ? 0.3%. The a p p l i c a t i o n of volume-colorimetry t o t h e micro-determination of a l k a l o i d s has been described (68). I n t h i s method, t h e a l k a l o i d i s p r e c i p i t a t e d with Scheib l e r ' s phosphotungstic a c i d r e a g e n t , t h e p r e c i p i t a t e i s t r e a t e d with sodium amalgam, and t h e blue c o l o r of t u n g s t i c anhydride i s tit r a t e d v o l u m e t r i c a l l y with potassium permanganate t o a d i s appearance of t h e b l u e c o l o r . Several o t h e r complexometric determinat i o n s of a l k a l o i d s , including q u i n i d i n e , have been a l s o r e p o r t e d (69-72).
9.3.4
Amperometric The e l e c t r o g e n e r a t i o n of bromine has been used i n t h e assay of alkenes (73-75). The coulometric generation of bromine as a t i t r a n t w a s used as a b a s i s of a coulometric method of a n a l y s i s of quinidine s u l f a t e and o t h e r medicinals. The r e a c t i o n between bromine and t h e s e drugs i s t o o slow t o permit t h e use of a
523
QUINIDINE SULFATE
conventional amperometric end-point detection technique. A residual method combining a standarised arsenite solution with amperometry was found to give excellent results ( 7 6 ) . Quinidine sulfate gave relative standard deviation of less than 2% and relative error of less than 0.5% using the arseno-amperometric endpoint device. The method was applied to the analysis of quinidine sulfate powder and quinidine sulfate tablets ( 7 6 ) . 9.3.5
Polarographic Polarographic analysis of cinchona alkaloids has been reported(77-79). The oscillopolarographic behaviour of these alkaloids was studied and the oscillograms of quinidine in N LiC1, N LiOH, N NaOH, and N H2SO4 were obtained with the use of dropping and streaming mercury electrodes ( 7 7 ) . The depolarisation potentials were reported and various possibilities of the differentiation of similar derivatives were investigated. Even 0.0001 M solution of quinidine , and other cinchona alkaloids, can be detected with the use of oscillopolarographic methods. Molnar (78) has published quantitative polarographic determination of cinchona alkaloids, including quinidine. These alkaloids give characteristic oscillograms which can be used for their determination with an accuracy of 24%.
9.4 Chromatography 9.4.1. Paper Chromatography Clarke(l1) has described several solvent systems for identification of quinidine, as shown in Table 5.
MOHAMMED A . LOUTFY ETAL..
524
Table 5. Paper Chromatography of Quinidine Solvent System 1. Citric acid-n-butanol -water (4.8gm:870 ml: 130 ml)
Visualizing agent UV, iodoplatinate spray
2. Acetate buffer ( pH=4.58 )
3. Phosfate buffer (pH=7.4 Several paper chromatographic methods (80-85)have been described for the separation, identification and quantitative determination of cinchona alkaloids including quinidine. Alwas et al. have described application of paper ionophoresis for the separation of alkaloid mixture including cinchona alkaloids (86). The electrophoresis is carried out on Whatman No. 1 paper at 1 mA per Cm and 300 V for 3 hours. The solution of alkaloids (10 to 30 g) are applied to the paper near the anode, and the strips are moistened with 1% aqueous ammonium carbonate (pH 7-8). The separated alkaloids can be determined quantitatively after elution from the paper. Quenzer and Hardy (87)have reported a death investigation involving quinidine. Chromatographic procedures, performed on samples of brain, kidney, liver, blood, and gastric content, indicated that the cause of death was an overdose of quinidine. The drug extraction recovery from spiked whole blood sample was 89%.
9.4.2
Thin-Layer Chromatography About 35 cinchona alkaloids are known, of which quinidine and quinine are the pharmaceutically most important, quinidine because of its cardiac depressant and quinine because of its antimalarial properties. These two alkaloids have been studied by TLC more extensively than the other cinchona alkaloids such as the stereoisomers cinchonine and cinchonidine (both of which lack the methoxy group at C6, which is present in
Table 6.
TLC Techniques Used for Quinidine
Solvent System
1. Chloroform-diethylamine (9:l)
2. Chloroform-methanol
-
25% ammonia (85:14:1)
3. Chloroform-acetone - diethylamine (5:4:1) 4. Chloroform-acetone - (3 m l 25% ammonia + 17 m l zbsolute ethanol) (5:4:1) 5. Chloroform-acetone-methanol - 25% ammonia (60:20:20:1) 6. Chloroform-ethyl acetate - isopropanol-diethylamine (20:70:4 :6) 7. Chloroform-dichloromethane-diethylamine (20:15:5 ) 8. Dichloromethane-diethyl ether-diethylamine (20:15:5) 9. Kerosene-acetone-diethylamine (23:9:9) 10. Acetone - 25% ammonia (58:2) 11. Ethyl acetate - isopropanol - 25% ammonia (45:35:5) 12. Toluene - ethyl acetate - diethylamine (7:2:1) 13. Toluene - ethyl acetate - diethylamine (10:10:3) 14. Toluene - diethyl ether - diethylamine (20:12:5) 15. Toluene - diethyl ether - dichloromethane-diethylamine (20:20:20 :8)
h Rf (Rf x 100)
Ref.
28 44 26 26
140 130 97,141
41
142 141
21
34 35
41 37 55 20
142
-
141
143 143 143
28 26
108
29
127
108
contd..
.. h Rf (Rf x 100)
Solvent System
16. Carbon tetrachloride - n - butanol - methanol - 10% ammonia (12:9:9 :1) 17. Cyclohexanol-cyclohexane-n-hexane (1:l:l)+ 5%
71
144
60
144
46 55
128
diet hylamine
18. Methanol
-
25% ammonia (1OO:l)
19. Strong ammonia
- methanol
(1.5:lOO)
Ref.
11
20. Chloroform-acetone-diethylamine (20:20:1)
145
21. Benzene-diethyl ether-diethylamine (20:12:5 )
101
22. Methanol
- chloroform-diethylamine
(50:50 :1)
45
137
Table 7.
TLC Detection of Q u i n i d i n e
Color
Ref.
-
-
Light b l u e
88
Yellow
Orange-red
Munier
Light yellow
Orange-red
-
Munier, sodium n i t r i t e
Light yellow white
Brown
130
Vaguj f a l v i
Light yellow
Orange
-
Bregoff-Delwiche
Light yellow
Orange
88
4.
Iodine vapour
Yellow white
Brown
88
5. 6.
Iodine i n potassium i o d i d e
White
Brown
-
Iodine i n methanol
Light yellow
Brown
146
7. 8.
Iodine vapour, p r r o l e vapour
Yellow
Brown
147 135
9.
F e r r i c c h l o r i d e , i o d i n e i n potassium i o d i d e
Reagent
1.
Quenching, 254 nm
2.
Fluorescence, 366 nm (formic a c i d or sulphuric a c i d s p r a y )
3.
Dragendorf f ' s modification : Munier
s
Background Color
-
Macheboeuf
Iodine i n potassium i o d i d e and s i l v e r acetate
Light green yellow
Brown
148
.
contd..
Background Color
Color
Ref.
10. Iodoplatinate
Violet
Violet
-
11. I o d o p l a t i n a t e , a c i d i f i e d
Dark v i o l e t
Violet
149
12. F e r r i c hexacyanoferrete (111)
Light green blue
138
13. F e r r i c chloride-perchloric a c i d
Yellow white
Dark green blue Violet
14. 15. 16. 17.
Light orange
Orange
134
InUV: b l u e
150
Reagent -
~~~
~
Methyl orange Tetraphenylborate, q u e r c e t i n
-
-
Phenothiazine, i o d i n e vapour
Violet
Brown
147
Phenothiazine, bromine vapour (ammonia vapour)
Violet
Green
147
529
QUINIDINE SULFATE
q u i n i d i n e and q u i n i n e ) , and t h e i r c o r r e s ponding dihydro d e r i v a t i v e s d i h y d r o q u i n i d i n e and dihydroquinine ( i n which t h e v i n y l group a t C 3 i s r e p l a c e d by an e t h y l g r o u p ) . TL chromatographic s e p a r a t i o n of cinchona a l k a l o i d s has been reviewed by Verpoorte, e t al. ( 8 8 ) , w i t h emphasis on t h e mobile phases used, and t h e s e n s i t i v i t i e s of v a r i o u s d e t e c t i o n methods. Some g e n e r a l conclusions are drawn on t h e e s t a b l i s h m e n t of optimum c o n d i t i o n s f o r s p e c i f i c separat i o n s of cinchona a l k a l o i d s . TLC s e p a r a t i o n (89-106) and TLC i d e n t i f i c a t i o n of cinchona a l k a l o i d s i n food(107-108) and i n b i o l o g i c a l material (109-123) have been r e p o r t e d . S e p a r a t i o n , i d e n t i f i c a t i o n , and q u a n t i t a t i v e d e t e r m i n a t i o n of q u i n i d i n e , and o t h e r cinchona a l k a l o i d s o f a b u s e have been r e p o r t e d (124-136) S e p a r a t i o n o f q u i n i d i n e and q u i n i n e from d i h y d r o q u i n i d i n e and dihydroq u i n i n e has been d e s c r i b e d (88).
,
Table 6 l i s t s s o l v e n t s used f o r t h e separat i o n o f q u i n i d i n e . The TLC d e t e c t i o n methods are given i n Table 7. D e t e c t i o n of dihydro-alkaloids i n commercial q u i n i d i n e and q u i n i n e has been p u b l i s h e d
(137). Hashmi e t al. (138)have r e p o r t e d semiq u a n t i t a t i v e d e t e r m i n a t i o n of cinchona a l k a l o i d s by c i r c u l a r TLC. Robles and Wient j e s ( 139 ) have s t u d i e d , by TLC, t h e decomposition on s t e r i l i z a t i o n , of q u i n i d i n e hydrogen s u l f a t e .
9.4.3 -
G
A g a s - l i q u i d chromatographic d e t e r m i n a t i o n of q u i n i d i n e s u l f a t e has been adopted i n our l a b o r a t o r y , u s i n g a Varion GC-3700 gas chromatograph equipped w i t h a flame i o n i s a t i o n d e t e c t o r . The g l a s s column ( 2 m x 2 mm w a s packed w i t h 3% OV-17 on 80-100 mesh Chromosorb W HP. The c a r r i e r gas ( h e l i u m ) flow-rate w a s maintained a t 25 ml/minute. Ethanol w a s used a s s o l v e n t and t h e c h a r t speed w a s a d j u s t e d t o g i v e 1 cm/minute.
MOHAMMEDA. LOUTFY E T A .
530
Fig. 10 GLC of Quinidine Sulfate
0-Desmethylquini.dine 3-Hydroxy-quinidine
Quinidine
Quinidine-lO.11dihydrodiols I
L
&
,
~~
1
1
I
I
10 20 30 40 50 60 70 min Fig. 11. HPLC Separation of Quinidine Metabolites 0
QUINIDINE SULFATE
531
The retention time = 13.5 minutes. The GLC of quinidine sulfate is illustrated in Fig. 10. Separation and quantitative determination of cinchona alkaloids, among which quinidine is included, by TLC and GLC, has been described (97). In this method, the column was packed with 2% OV-17 on AW Gas-Chrom p.
A GLC determination of dihydro impurities in quinidine salts has been developed by Smith et al. (95). Midha and Charette (151)have described a gas-liquid chromatographic determination of quinidine from plasma and whole blood. Metabolites of quinidine do not interfere and the limit of detection is 50 ng of quinidine per m l . Other gas-liquid chromatographic assays of quinidine has been also described (152-153).
9.4.4 High-Performance Liquid Chromatography HPLC separation of quinidine metabolites is given in Fig. 11 (44). High-performance liquid chromatographic systems for quinidine and its metabolites are listed in Table 8 , along with specificity information and cited references.
(153) have described Reece and Peikert a comparison of HPLC and GLC assays. HPLC analyses of quinidine and dihydroquinidine in plasma samples have been carried out using reversed-phase sy~tems(159~161-162). An HPLC assay has been described (163), employing extraction and post-column acidification with fluorescence detection, and without use of internal standardisation. Other HPLC procedures for quinidine and other alkaloids have been reported (164-165).
9.5 Spectrophotometry 9.5.1
Colorimetric
A micro-determination of quinidine and
Table 8.
Column
HPLC Systems of Q u i n i d i n e Retention t i m e (minute )
Mobile phase
Chloroform-methanol (8:2)
1. Merckosorb S i 60 (5 v m )
6.5
t n t4 W
Methanol-water-acetic
154
W , 254 nm
155
2.9 2.4
(6:4)
,
W, 254 nm and 280 nm.
3.7
(7:3) A reversed-phase Bondapak
Ref.
6.2
(7:3) D i e t h y l ether-methanol (8:2)
2.
Detection
acid
(25:75:1)
(80 :20 :1) water-acetic a c i d ( 9 9 : l )
+
U V , 254 nm.
44
w a ter-acet o n i trile -a c e t i c acid (40 :59 :1)
3.
A S i l i c a gel
1 . 5 mM phosphoric a c i d a c e t o n i t r i l e (90 :lo)
fluorescence,
153
0.05 M phosphate b u f f e r (pH=3)a c e t o n i t r i l e (73:27)
UV, 254 nm and 325 nm.
156
tetrahydrofuran-ammonium hydroxide D i e t h y l ether-waterdiethylamine
418 nm
-
106
~~
Mobile phase
4.
Bondapak alkyl phenyl
Retentlon time (minute)
0.05 M phosphate buffer (pH 4.75)acetonitrile-tetrahydrofuran (80:15:5)
0.75 M-acetate buffer (pH=3.6)- acetonitrile (3:2)
5. Li Chrosorb Si 60
Chloroform-isopropyl alcoholdiethylamine-water (940:57:1:2.65)
~~
~~
Detection
Ref.
W,230 nm or
158
fluorescence
W , 330 nm.
159
UV, 312 nm
160
MOHAMMED A. LOUTFY ETAL.
534
quinine in serum has been described (166). The method is suitable for determining concentration up to 1 mg per 100 ml, The c o l o r , formed with Rose bengal, is measured at 550 nm. Vukcevic and Bozin( 167)have published a quantitative analysis of alkaloids, including quinidine, in cinchona tincture by chromatography and spectrophotometry, Schmitz and Menges (168) have determined cinchona alkaloids in galenical preparations with Tropaeolin 00. Graham and Thomas (169) have reported a quantitative assay of quinidine, and other alkaloids, by color reaction with dichromate-sulphuric acid.
9.5.2
Ultraviqlet Kamath et. al. (170) have described the W absorption spectra of quinidine, and other cinchona alkaloids, in 11 aliphatic alcohols. The extinction coefficient of cinchonine and cinchonidine at 332 nm are c! 2 to 4% of those of quinine and quinidine at the same wavelength. Thus, quinidine, or quinine, can be determined in the presor cinchonidine ence of cinchonine and 1 to 4% in aliphatic alcohol to within medium. Kracmar and Kracmarova (171) have studied the influence of structure and solvent on the spectrophotometric behaviour of quinidine, and other drugs containing quinoline and isoquinoline chromophores.
9.5.3
Infrared Hayden and Sammul (12) have reported a study of the cinchona alkaloids in potassium bromide discs and applied KBr disc technique to the analysis of these alkaloids. Under certain experimental conditions, anomalous IR spectra are obtained for quinidine and quinine. Cinchonine and cinchonidine do not exhibit significant variations in spectra.
-
QUINIDINE SULFATE
535
9.5.4 Nuclear Magnetic Resonance In the development of of dihydro impurities taining quinidine and tion was given to the Huynh-Ngoc and Sirois
a method for control in preparations conquinine salts considerause of NMR, following (172).
9.5.5 Atomic Absorption Spectrometry Recently, an indirect determination of quinidine , and other alkaloids , by atomic absorption spectrometry, has been developed (173).
9.5.6
Spectrofluorimetric Gelfman and Seligson (174)have described the determination of quinidine in serum by precipitation-fluorescence method. In this method, trichloroacetic acid is shown to be a satisfactory substitute for metaphosphoric acid as a protein precipitant in the fluorimetric assay of quinidine in serum. The original protein precipitation - fluorescronce method (175) is still widely used together with extraction - fluorescence methods( 176-177)to determine quinidine and its metabolites. Other fluorimetric methods for quantitation of quinidine have been reported (118,178-179). Ivanenko (180)has published fluorimetric determination of quinidine in bile and blood. The method is based on extraction technique. Alekseichik et al. (181) has described qualitative analysis of quinidine, and other drugs, by determining their fluorescence spectra in ethanol , concentrated HC1, 10% NaOH, and aqueous solutions at 0.01-0.001 mg /ml
.
MOHAMMED A. LOUTFY ETAL.
536
10. References 1.
J.C. Grasselli and W.M. Ritchey "Atlas of Spectral Data and Physical Constants for Organic Compounds", 2nd ed., Vol. IVY CRC Press Inc., Cleveland, Ohio, (1975).
2.
I.L. Finar "Organic Chemistry" Vol. 2, Stereochemistry and the Chemistry of Natural Products, 5th ed., Longmans, London (1975)
.
3. R.B. Turner and R.B. Woodward "The Chemistry of Cinchona Alakloids" in "The Alkaloids", R.H.F. Manske and H.L. Holmes Eds., Vol. 3, p. 1-63, Academic Press, New York,
(1953)
4. V. Prelog and E. Zalan', Helv. Chim. Acta, 3, 535 (1944). 5.
G.G. Lyle and L.K. Keefer, Tetrahedron, 23, 3253, (1967).
6.
%pecifications for the quality Control of Pharmaceutical Preparations" World Health Organization, Geneva, (1967).
7. W.O. Foye "Principles of Medicinal Chemistry" Lea and Febiger, Philadelphia (1976). 8. "The Pharmaceutical Codex" 11t& Press, London (1979).
ed., The Pharmaceutical
9. "The British Pharmacopeia" Her Majesty Stationary Office, Cambridge ( 1980 )
.
10. J.S. Glasby "Encyclopedia of the Alkaloids" Vol. 2, p. 1152, Plenum Press, New York (1975). 11. E.G.C. Clarke "Isolation and Identification of Drugs" Vol 1, p. 531, "The Pharmaceutical Press" London,(1978).
.
12. A.L. Hayden and O.R. Sammul, J. her. Phartn. Assoc.
Sci. Ed., Q, 489, (1960).
13. F.I. Carroll, D. Smith, M.E. Wall and C.G. Moreland,
J. Med. Chem.,
17,985
(1974).
14. C.G. Moreland, A. Philip and F.I. Carroll, J. Org. Chem., 3-9, 2413 (1974). Finkle, R.L. Faltz and D.M. Taylor, J. Chromatog. Sci., l 2 , 304, (1974).
15. B.S.
QUINIDINE SULFATE
537
16. K.H. Palmer, B. Martin, B. Baggett and M.E. Wall, Biochem. Pharmacol., 18,1845 (1969). 17. "The Merck Index" 9 t & N.J. (1976).
ed. "Merck and Co. Inc. , Rahway,
18. "Remington's Pharmaceutical Sciences" 15th ed. p. 795 "Mack Publishing Company" Easton , Pennsylvania (1975). 19. M,S. Karawya "The Alkaloids" Cairo University (1971).
p. 116, Faculty of Pharmacy,
20. T.A. Henry "The Plant Alkaloids" Blakiston, Philadelphia (1949). 21. P. Rabe and Kindler , Ber.
4th ed.,
p. 421,
, 51, 466, (1918).
22. J. Gutzwiller and M.R. Uskokovic, Helv. Chim Acta, 1494, (1973)
56,
23. W.E. Doering, G. Cortes and L.H. Knox, J. Amer. Chem. SOC. 69, 1700 (1947). 24. R.B. Woodward and W.E. Doering, J. Amer. Chem. SOC.,66, 849, (1944); Ibid, 860 (1945).
a,
25. M. Uskokovic, J. Gutzwiller and T. Henderson, J. Amer. Chem. SOC., 92, 203, (1970). 26. J. Gutzwiller and M. Uskokovic, Ibid, 2, 20, 204, (1970). 27. M. Gates, B. Sugavanam and W.L. Schreiber, Ibid, 92, 205, (1970). 28. E.C. Taylor and S.F. Martin, Ibid, 94,6218, (1972). 29. G. Grethe, H.L. Lee, T. Mitt and M.R. Uskokovic, Helv. Chim. Acta, gh, 1485, (1973).
30. F.J. Muhtadi, M.A. Loutfy and M.M.A. Hassan "Analytical Profile of Quinine Hydrochloride in Analytical Profiles of Drug Substances" Ed. K. Florey, Vol. 12, (1983). 31. R. Goutarel, M.M. Janot, V. Prelog and W.I. Taylor, Helv. Chim. Acta, 33, 150, (1950). 32. N. Kowanko and E. Leete, J. Amer. Chem. SOC., 4919 (19621
&,
MOHAMMED A . LOUTFY ETAL..
538
33. A.R. Battersby, R.T. Brown, R.J. Kapil, J.A. Knight, J.A. Martin and A.O. Plunkett, Chem. Comm., 888, (1966). 34. E. Leete and J.N. Wemple, J. her. Chem. Soc., 88, 4743, (1966). 35. E. Leete and J.N. Wemple, J. Amer. Chem. sot., 91,
2698 , (1969)
36. A.R. Battersby and E.S. Hall, Chem. Comm., 194 (1970). 37. A.R. Battersby and R.J. Parry, Chem. Corn., 30, ( 1971
-
2,
38. F.I. Carroll, A. Philip and M.C. Coleman, Tetrahedron lett. , 21, 1757 (1976). 39. D.E. Drayer, C.E. Cook and M.M. Reidenberg, Clin. Res., 24, 623A (1976). 40. D.E. Drayer, D.T. Lowenthal, K.M. Restivo, A. Schwartz, E.C. Cook and M.M. Reidenberg, Clin. Pharmacol. Ther., 24, 31 (1978).
41. T.W. Guentert, P.E. Coates, and S. Riegelman, Acad. Pharm. Sci. , a(l), 137 (1978). 42. T.W. Guentert, R.A. Upton, N.H.G. Holford and S. Riegelman, J. Pharmacok. Biopharm. , 1,303 (1979).
43. B.B. Brodie, J.E. Baer and L.C. Craig, J. Biol. Chem., 188, 567, (1951).
44. S.E. Barrow, A.A. Taylor, E.C. Horning and M.G. Horning, J. Chromatog.,
181,219
(1980).
45. J.T. Bigger Jr. and B.F. Hoffman in "Goodman and Gilman's The Pharmacologica.1Basis of Therapeutics" Eds. A. Goodman Gilman, L.S. Gocdman and A. Gilman, 6 t& ed., p. 7 7 0 , Macmillan Publishing Co. Ind., New York, (1980).
46. C.T. Ueda, B.J. Williamson and B.S. Dzindozio, Clin. Pharmacol. Ther., 20, 260 (1976).
47. D.J. Greenblatt, H.J. Pfeifer and H.R. Ochs, J. Pharmacol. Exp. Ther. , 202, 365 (1977).
539
QUINIDINE SULFATE
48. T.W. G u e n t e r t , N.H.G.
Holford, P.E. Coates, R.A. Upton and S. Riegelman, J. Pharmacok. Biopharm., 2, 315 (1979).
49. E.P. H i a t t , J. Pharmacol. Exp. Ther., 8 l , 160 (1944). 50. E.M.L.
D i t l e f s e n , Acta Med. Scand.,
51. H.L. Conn Jr., and R . J . 509, (1961). 52. K.M.
K e s s l e r , D.T. Briggs and M.M. 706, (1974).
W.
53. K.A.
55,
146,81
(1953).
Luchi, J. C l i n . I n v e s t . ,
40,
Lowenthal, H. Warner, T. Gibson, Reidenbury, New Engl. J. Med., 290,
Conrad, B.L. Molk and C.A.
Chidsey, C i r c u l a t i o n ,
1 (1977).
54. H.R. Ochs, D . J . P f e i f e r and T.W.
G r e e n b l a t t , E. Woo, K. Franke, H . J . Smith, h e r . J. C a r d i o l . , 770 (1978).
41,
55. R.E. Gerhardt, R.F. Knouss, P.T.
Thyrum, R . J . Luchi and J.J. Morris Jr., Ann. I n t e r n . Med., 71,927 (1969).
56. "The United S t a t e s Pharmacopeia" , X I X , Mack P u b l i s h i n g Co., Easton, P a . , p. 435 (1975). 57. H.A. Dingjan, S.M. Dreyer-Van Der Glass, and G.T. T j a n , Pharm. Weekbl., 115, 445 ( 1 9 8 0 ) . 58. M. Hafez, College of Pharmacy, King Saud U n i v e r s i t y , P e r s o n a l Communication.
59. W. Poethke and R. Wigert, Pharm. Z e n t r a l h . , 100,646 ( 19611. 60. L. V i g n o l i , J. Delphaut, and C. Doquin, Trav. SOC. Pharm. M o n t p e l l i e r , 6, 1 0 1 (1946).
61. W . S c h n e i d e r , Dtsch. Apothztg.,
101,1259
(1961).
62. J. J e r z y , Farmacja P o l . , 29,1107 ( 1 9 7 3 ) . 63. G . N .
Thomis and A . Z .
K o t i o n i s , Anal. Chim. Acta,
&,
457 (1956). 64. M. Rink, R . L i z , and K. Riemhofer, Dtsch. Apothztg.,
100, 1231
(1960).
MOHAMMED A. LOUTFY ETAL..
540
65. B. Waligora and M. Paluch, Chem. Anal., Warsaw, 9, 239 (1964). 66. I. Simonyi and G , Tokar, Acta Chim. Acad. S c i . Hung., 2 5 , 305 (1960). 67. S. Rolski, M. Gajewska, and E. Matusak, Farm. P o l . , 25, 111 (1969). 68. A . I . Matiu, C. Popescu, and A. Ghiorghiu, P r o d u i t s Pharm., 3, 295 (1948). 69. P. Majlat and I. Bayer, Acta Pharm. Hung. , 33, 77 (1963). 7 0 . A. Z a i t s e v , Aptechnoe Delo,
71. B.
6,48
(1957).
Budesinsky and E. Vanickova, Cekosl. Farm,
77 (1958).
72. C.V. Yeh and F.H. Tsang, Yao Hsueh Pao, l.0,
2,
10
(1963).
73. F. Baumann and D. G i l b e r t , Anal. Chem, 35, 1133 (1963).
74.
F.H. Merkle and C.A.
117 (1962).
Discher, J. Pharm. S c i . ,
2,
75. F.A. Leisey and J.F. Grutsch, Anal Chem. , 28, 1553 (1956).
76. R.L. Charles and A.M. Knevel, J. Pharm. S c i . 1678 (1965).
, &,
77. L. Molnar and K. Molnarova, Chem. Z v e s t i , ll, 259 (1957). 78. L. Molnar, Acta Chim. Acad. Sci. Hung., 2, 273 (1956). 79. M. Souckova and J. Zyka, Ceckosl. Farm., 80. R.N. Rama and N . J .
Singh, C u r r . S c i . ,
L,
227 (1955).
bJ, 193 (1980).
81. L.A. D a l Cortivo, C.H. Willumsen, S.B. Weinberg, and W. Matusiak, Anal. Chem, 33, 1218 (1961).
82. H.V. S t r e e t and S.K. Niyogi, Nature, 190, 1199 (1961). 83. H. S t e g e r and A. S t o r z , Pharmazie,
16,126
(1961).
84. I. Jakube, V. Laskova, and E. Slamova, Farmacia, 25, 137 (1956)
.
QUINIDINE SULFATE
541
85. J. Kolankiewicz and M. Nikonorow, Acta Polon. Pharm., 16, 115 (1959). 86. I. Alwas, J. Derlikowski, A.B. Narbutt-Mering, E. Perko. 8 , 357 (1961). wski, and W. Weglowska, ibid, l 87. C.F. Quenzer and D.R. Hardy, J. Anal. Toxicol.,
(1980).
&, 54
.
88 R. Verpoorte, T. Mulder-Krieger, J.J. Troost, and A.B. Svendsen, J. Chromatogr. , 184,79 (1980).
89. A. Suszko-F’urzycka and W. Trzebny, J. Chromatogr., 16, 239 (1964). 90. 91. L. Horhammer, H. Wagner, and J. Holzl, Deut. Apoth. Ztg. , 110,227 (1970). 92* H. Bohme and R. Bitsch, Arch. Pharm. (Weinheim), 303, 456 (1970). 93. Ibid, 303, 418 (1970). 94. J. Storck, J. P. Papin, and D. Plas, Ann. Pharm. 28, 25 (1970).
Fr.
,
95. E. Smith, S. Barkan, B. ROSS, M. Maienthal, and J. Levine, J. Pharm. Sci. , 62, 1151 (1973). 96. M. Petkovic , Acta Farm. Jugosl. , 2 4 , 23 (1974). 97. M. Sarsunova and J. Hrivnak, Pharmazie, 29, 608 (1974). 98. R.O.B. Wijesekera, L.S. Rajapakse, and D.W. Chelvarajan, J. Chromatogr. , 121,388 (1976). 99. R.R. Paris, R. Rousselet, M. Paris, and J. Fries, Ann. Pharm. Fr. , 23, 473 (1965). 1OO.V. Schwarz and M. Sarsunova, Pharmazie , 2,267 (1964).
101.N. Oswald and H. Fluck, Pharm. Acta Helv., 102.F. Wartmann-Hafner , ibid , 41, 406 (1966)
2,293 (1964).
.
103.G.H. Jolliffe and E.J. Shellard, J. Chromatogr. , 48, 125 (1970).
MOHAMMEDA. LOUTFY ETAL.
542
104.
P. Vacha, P. Cuba, V. P r e i n i n g e r , L. Hruban, and F. Santavy, P l a n t a Med. , 12, 406 (1964).
105.
118,276
106.
K. Chmel and V. Chmelova-Hlavata, J . Chromatogr.
,
(1976).
N.J. Pound and R.W. S e a r s , Can. J. Pharm. S c i . , 10, 122 (1975).
148,1 ( 1 9 7 2 ) .
107. H. Hey, Z. Lebensm. Unters. F o r s c h . , 108.
G. Barwald and J. Prucha, Monatsschr. Brau., 26, 190 (1973).
109.
V.P. Dole, W.K. Kim,and I. E n g l i t i s , J. h e r . Med. Ass., 115 (1966).
110.
J.G. Montalvo, E.Klein, D. Eyer, and B. Harper, J. Chromatogr. , 542 ( 1 9 7 0 ) .
198,
47,
111. S . J . Mule, i b i d ,
55,
255
(1971).
112.
M.M. Baden, N.N. Valanju, S.K. Verma, and S.N. Valanju, h e r . J. C l i n . P a t h o l . , 57, 291 (1972).
113.
W.T. F i s c h e r , A.D. B a i t s h o l t s and G.S. Grau, J. Chromatogr. S c i . , 10,303 (1972).
114.
J.M.
Meola and M. Vanko, C l i n . Chem.,
20, 184 (1974).
115. R.J.
Kokoski and M. J a i n , C l i n . Chem.
, 21, 417 (1975).
116.
Steyn and H.K.L.
J.M.
Hundt, J. Chromatogr.
, 111,
463 1975). 117. R.E.
118.
Stoner and C . P a r k e r , C l i n . Chem.
, 20,
G. Hartel and A. Harjanne, C l i n . Chim. Acta,
309 (1974).
23,
289
(1969). 119.
R . C . Baselt and L . J . 139 (1971).
120.
K.G.
Blass, R . J .
Casarett, J. Chromatogr.,
T h i b e r t , and T.F.
75 (1974). 121.
M. Debackere and L. L a r u e l l e , i b i d ,
57,
Draisey, i b i d ,
95,
35, 234 (1968).
543
QUINIDINE SULFATE
122. G. Hartel and A. Korhonen, ibid, 37, 7 0
123. J. Christiansen, ibid,
(1968).
s, 57 (1976).
124. K. Wahl and T. Rejent, J. Anal. Toxicol., 3, 216 (1979). 125. B. Davidow, N. Li Petri, and B. Quame, Tech. Bull. Regist. Med. Technol. , 33, 298 (1968). 300 (1965). 126. J.A. Steele, J. Chromatogr., 9,
127. J. Paul and F. Conine, Microchem. J., 128. F. Conine and
18,42 (1973).
J. Paul, Mikrochim. Acta,
2, 443 (1974).
129. P.A.F. Pranitis and A. Stolman, J. Chromatogr., 106, 485 (1975). 130. F. Sunshine, W.W. Fike and H. Landesman, J. Forensic Sci. , 2,428 (1966). 131. W.W. Fike, Anal. Chem. , 3, 1697 (1966). 132. A. Noirfalise and G. Mees , J. Chromatogr. , 31, 594
(1967).
133. T.M. Holdstock and H.M. Stevens, Forensic Sci.,
6, 187 (1975).
134. S. Thunell, J. Chromatogr., 130, 209 (1977). 135. K.K. Kaista and J.H. Jaffe, J. Pharm. Sci. , 61, 679
-
(1972)
136. R.L. Neman, J. Chem. Educ.,
49,834 (1972).
137. A. Suszko-Purzycka and W. Trzebny, Pyrzyjaciol Nauk, Wydzial Lek. Prace Kom. Farm. &, 3504 (1967); Anal. Abstr. , 14,3504 (1967). 138. M.H. Hashmi, S. Parveen, and N.A. Chughtai, Mikrochim. Acta, 449 (1969). 139. M.A. Robles and R. Wientjes, Pharm. Weekbl., 96,379 (1961). 140. C. Mdder and D.B. Faber, ibid, 108,289 (1973).
544
MOHAMMED A. LOUTFY ETAL..
141.
P.J. Beljaars and P.J. Koken, J. A s s . Off'ic. Anal. Chem. , 56, 1284 (1973).
142. A.M.
Guyot-Hermann and H. Robert, J. Pharm. B e l . ,
28, 557 (1973)-
143. C . Andary, Trav. 307 (1970). 144. J . M . G . J .
SOC. Pharm. M o n t p e l l i e r ,
F r i j n s , Pharm. Weekbl.
145. K . I . B r a l i n o v a , Farm. 93,245555 (1980).
Zh.,
&,
30,
, 103,929 (1968).
70
(1980); Chem.
Abstr.,
146. A.C.
Moffat, K.W. Smalldon, and C. Brown, J. Chromatogr., 90,1 (1974);A.C. Moffat and K.W. Smalldon, i b i d , 90, 9 (1974).
259, 277 (1972).
147. R.A.
E g l i , Z. Anal. Chem.,
148. F.
Schmidt, Deut. Apoth. Ztg.
149. J.
S t o r c k and J.P.
, 114,1593 (1974).
Papin, B u l l . SOC. Chim. F r . ,
105 (1973).
150. R. Neu, J. Chromatogr.
, 11,364 (1963).
151. K.K. Midha and C. C h a r e t t e , J. Pharm. S c i . 1244 152. J . G .
(1974).
Flood, G.N.
, 63,
Bowers, R.B. McComb, C l i n . Chem., 26,
197 (1980). 153. P.A. Reece and M. P e i k e r t , J. Chromatogr.
207 (1980).
154. R.
Verpoorte and A.B.
Svendsen, i b i d ,
, 181,
100,227 (1974).
155. M.A. Johnston, W . J . Smith, J . M . Kennedy, A.R. Lea, and D.M.
Hailey, i b i d ,
156. J . T . Ahokas, 65 (1980). 157. R.
189,241
C. Davies, P.J. R a v e n s c r o f t , i b i d ,
G i m e t and A. F i l l o u x , i b i d ,
158. T.W. ibid,
(1980).
G u e n t e r t , A. R a k h i t , m, 514 (1980).
R.A.
183,
177,333 (1979). Upton, and S . Riegelman,
545
QUINIDINE SULFATE
159.
160. M.
Bauer and G. Untz, J . Chromatogr.,
161. W.G.
, 23, 2030 (1977).
162.
R.E. Kates, D.W. Pharm. S c i . ,
McKennon, and T . J .
67,269
B.J.
K l i n e , V.A.
(1978).
Turner, and W.H.
51, 449 (1979).
164.
B. Bousquet, F e u i l l . B i o l . , 20, Abstr. , 39, 148 (1980).
165. R.G.
Achari and J . T .
M. Hasselmann, Compt. Rend., Abstr. , 5, 2316 (1958).
167. V. Vukcevic and 18, 111 (1968). 168. B. Schmitz and 747 (1957). 169. H.D. Graham 901 (1961). 170. B.R.
Chem.
53 (1979);Anal.
Thomas, J. Pharm. S c i .
, 50,
Bhat, and S.L. Bafna, I n d i a n J .
Kracmar and J. Kracmarova, Pharmazie,
-
, 97,
(1968).
510 (1974).
172. T. Huynh
3, 81 (1980).
244, 2860 (1957);Anal.
W. Menges, Dtsch. Apothztg.
and L.B.
510
Barr, Anal. Chem.,
Z. Bozin, Acta Pharm. J u g o s l . ,
Kamath, C.V.
, 6,
Comstock, J.
J a c o b , J. Chromatogr.,
166.
171. J.
192, 479 (1980).
Crouthamel, B. Kowarski, and P.K. Narang, C l i n .
Chem.
163.
299 (1978).
Powers and W. Sadee, C l i n . Chem., 24,
J.L.
3,
Ngoc and G. S i r o i s , Pharm. Acta Helv.,
49, 37 (1974).
173. Y.
Minami, T. M i t s u i , and Y . Fujimura, Bunseki Kagaku, 30, 811 (1981); Anal. A b s t r . , 43,70 (1982).
174. N. G e l h a n and D. 36, 390 (1961). 175.
S e l i g s o n , Amer. J. C l i n . P a t h . ,
B.B. Brodie and S. Undenfriend, J . Pharmacol. Exp. Ther. , 154 (1943).
78,
546
MOHAMMED A. LOUTFY ETAL..
176.
T.W.
Guentert and S. Riegelman, C l i n . Chem.,
2065 (1978).
177. T.W.
24,
G u e n t e r t , P.E. Coates, R.A. S. Riegelman, J . Chromatogr. ,
178. T .
D.L. Combs, and a,Upton, 59 (1979).
C r a m e r & V.
15, 553 (1963).
I s a k s s o n , Scand, J . C l i n . Lab. I n v e s t . ,
179. G. H a m f e l t and S. 68, 181 (1963).
Malers, Acta SOC. Med. Upsal.,
180. N.A. Ivanenko, Lab. 18, 327 (1970).
Delo,
2, 97 (1969);Anal.
Abstr.,
181. R.N.
A l e k s e i c h i k , V.P. Korolyux, E.A. Tukalo, and Safonova, Mater. Suezda Farm. B. SSR, 3 r d . , 115 (1977);Chem. Abstr. , 92, 99616 (1980).
E.D.
ACKNOWLEDGEMENT The a u t h o r s would l i k e t o t h a n k M r . Uday C . Sharma?for h i s s e c r e t a r i a l a s s i s t a n c e i n t h e r e p r o d u c t i o n of t h e manuscript. (*of College of Pharmacy, Department of Pharmacognosy , King Saud U n i v e r s i t y ) .
QUININE HYDROCHLORIDE Farid J . Muhtadi, Mohammed A . Loutfy, and Mahmoud M.A. Hassan 1. Description 1. I Nomenclature 1.2 Formulae 1.3 Molecular Weight 1.4 Elemental Composition 1.5 Appearance, Color, Odor, and Taste 2. Physical Properties 2.1 Melting Range 2.2 Eutectic Temperature 2.3 Solubility 2.4 Loss on Drying 2.5 pH Range 2.6 Optical Rotation 2.7 Spectral Properties 3. Preparation of Quinine Hydrochloride 3.1 Synthesis of Quinine 3.2 Quinine Hydrochloride 4. Synthesis of Quinine 4.1 Partial Synthesis 4.2 Total Synthesis 5. Biosynthesis of Quinine 6. Metabolism 7. Pharmacokinetics 8. Indications and Dosages 8.1 For The Treatment of Malaria 8.2 For The Relief of Nocturnal Leg Cramps 9. Toxicity 10. Methods of Analysis 10.1 Identification 10.2 Gravimetric Methods 10.3 Titrimetric Methods 10.4 Chromatographic Methods 10.5 Spectroscopic Methods References
ANALYTlCAL PROFILES OF DRUG SUBSTANCES VOLUME 12
547
548 548 548 554 554 554 554 554 554 554 554 555 555 555 567 567 567 569 569 569 583 586 587 587 587 588 588 589 589 59 1 591 595 606 612
Copyrighi by ihe American Pharmaceutical Assacration. ISBN 0-12-260812-7
FARID J. MUHTADI ETAL.
548
1. Description 1.1. Nomenclature 1.1.1 Chemical Names
a) Cinchonan-9-01, 6'-methoxy, (8a, 9R) hydrochloride (1:l) salt, dihydrate. b)
(8S, 9R)-6'-methoxy cinchonan-9-01, hydrochloride (1:1) salt, dihydrate.
c)
a-(6-methoxy-4-quinolyl)-5-vinyl-2-
quinuclidinemethanol, hydrochloride (1:l) salt, dihydrate.
1.1.2
-
d)
6-methoxy- a ( 5-vinyl-2-quinuclidinyl) -4-quinolinemethanol, hydrochloride (1:l) salt, dihydrate.
e)
( a s ) - ~.-(6-methoxy-quinolin-h y1)-
Generic Names Quinine Quinine Quinine Quinine
1.2.
a
-[ (2R, 4S, 5R)-( 5-vinylquinuclidin2 yl)] methanol, hydrochloride (1:l) salt, dihydrate.
hydrochloride j chloride; monohydrochloride; muriate.
Formulae 1.2.1 Empirical
549
QUININE HYDROCHLORIDE
1.2.2
Structural
The structure of quinine was finally postulated by Rabe (1)and was confirmed by the total synthesis of quinine which was achieved by several authors (2-7). 1.2.3
CAS Registry Number [ 130-89-2I
1.2.4
Wiswesser Line Notation T66 BNJ HOlE YQ-DT66 A B CNTJ AlUl & EH &
1.2.5
QH
(8)
Stereochemistry The stereochemistry of quinine and other related cinchona alkaloids is well summarised by Finar (9)and Turner and Woodward (10).
550
FARID J . MUHTADI ETAL.
If Q represents t h e quinoline h a l f , t h e s t r u c t u r e of q u i n i n e may be w r i t t e n as f o l l o w s :-
The above formula c o n t a i n s f i v e c h i r a l c e n t e r s : 1,3,4,8 and 9 . Since t h e b r i d g e must b e a c i s f u s i o n , c e n t e r s 1 and 4 behave as "one c h i r a l u n i t " , t h e r e f o r e , t h e number of o p t i c a l l y a c t i v e forms would be t h e same as o b t a i n e d from f o u r c h i r a l c e n t e r s . When t h e 1-8 bond i s broken, t h e c h i r a l i t y of t h e n i t r o g e n i s l o s t . Q u i n i n e , q u i n i d i n e , cinchonine and cinchonidine g i v e on d e g r a d a t i o n t h e o p t i c a l l y i d e n t i c a l 8oximino-3-vinylquinuclidine [ 1] , meroquinene [ 21 and c i n c h o l o i p o n i c a c i d [ 31. It t h e r e f o r e f o l l o w s t h a t t h e c o n f i g u r a t i o n s o f C and C4 are t h e same 3 f o r a l l t h r e e compounds.
Conclusive evidence f o r t h e c i s arrangement a t C3 and C 4 w a s provided by P r e l o g and Zalan (11). They reduced cinchonine t o dihydrocinchonine and converted t h e product i n t o c i n c h l o p i o n e t h y l e s t e r [ 4 1 i n which C3 and C 4 r e t a i n t h e o r i g i n a l conf i g u r a t i o n o f cinchonine. [ 4 ] w a s converted i n t o t h e dibromide [ 5 ] which by means o f a s e r i e s of r e a c t i o n s , a l l of which proceeded under mild c o n d i t i o n s and d i d not i n v o l v e t h e c h i r a l c e n t e r s , was converted i n t o 1,2-diethylcyclohexane [6]. This was shown t o be o p t i c a l l y i n a c t i v e ( i t could not be r e s o l v e d ) .
QUININE HYDROCHLORIDE
55 1
The o p t i c a l r e s u l t s provide c o n c l u s i v e evidence f o r a c i s arrangement of t h e two e t h y l groups i n t h e diethyl-cyclohexane [ 6 ] and s i n c e none of t h e s t e p s employed i n t h e conversion of c i n chonine t o [ 6 ] i n v o l v e s t h e c h i r a l c e n t e r s a t C3 and C4, t h e v i n y l group of t h e n a t u r a l cinchona b a s e s must be c i s t o t h e c7-c8 bond i n a l l alkaloids. The 9-deoxy d e r i v a t i v e s ( i : e , CH2 h a s r e p l a c e d CHOH) of cinchonine and c i n c h o n i d i n e have d i f f e r e n t s p e c i f i c r o t a t i o n s , a t + 179.3' and - 29.9', r e s p e c t i v e l y . Since t h e c o n f i g u r a t i o n s of C3 and C4 a r e t h e same i n b o t h b a s s e s and s i n c e C9 i s no l o n g e r o p t i c a l l y a c t i v e , t h e d i f f e r e n c e between t h e two must be a t c 8 , and t h i s i s therefore, a l s o t h e c a s e f o r cinchonine and cinchonidine. S i m i l a r l y s i n c e [ a ] o~f deoxyquinine i s - 97.7' and t h a t of deoxyq u i n i d i n e i s + 211.1', t h e n q u i n i n e and q u i n i d i n e d i f f e r a t c8. The assignment of c o n f i g u r a t i o n s a t c8 may be deduced from t h e f a c t t h a t q u i n i d i n e and c i n chonine a r e b o t h d e x t r o r o t a t o r y and b o t h can be converted i n t o t h e i r c y c l i c e t h e r s [ T I . On t h e o t h e r hand q u i n i n e and c i n c h o n i d i n e are b o t h l e v o r o t a t o r y and do not form c y c l i c e t h e r s .
FARID J. MUHTADI ETAL.
552
The c y c l i c e t h e r s t r u c t u r e i s only p o s s i b l e if t h e group a t t a c h e d t o C 3 and C 8 are i n t h e endop o s i t i o n [ 81. Thus i n cinchonine and q u i n i d i n e , t h e hydrogen atoms a t C 3 and c8 a r e c i s with r e s p e c t t o each o t h e r . Also,because C 4 and C 8 a r e c i s - o r i e n t e d , it follows t h a t t h e hydrogen atoms a t C 3 , C 4 and C 8 a r e a l l c i s - o r i e n t e d i n cinchonine and quinidine whereas i n cinchonidine and quinine t h e hydrogens a t C 3 and C 4 are c i s , but t h e hydrogen a t C 3 and c8 are t r a n s . For each c o n f i g u r a t i o n a t c8, two isomers a r e p o s s i b l e which d i f f e r i n o r i e n t a t i o n a t Cg. Since a l l a l k a l o i d s a r e i d e n t i c a l i n c o n f i g u r a t i o n except a t c8 and Cg, four isomeric substances a r e p o s s i b l e i n each s e r i e s . For example, two of t h e s e substances are presented by quinine and q u i n i d i n e , t h e o t h e r two members a r e epiquinine and epiquinidine. The o t h e r two members a r e cinchonine, cinchonidine, epicinchonine and epicinchonidine. I n most r e s p e c t quinine and quinidine p a r a l l e l one another c l o s e l y i n t h e i r chemical behavior and d i f f e r q u a l i t a t i v e l y from t h e isomeric p a i r , epiquinine and epiquinidine. Since quinine and quinidine d i f f e r i n c o n f i g u r a t i o n a t c8, t h e s e f a c t suggest t h a t t h e two a l k a l o i d s d i f f e r a l s o i n configuration a t C It i s p o s s i b l e t o deduce t h e c o n f i g u r a t i o n a t 9 by comparing t h e b a s i c i t i e s of quinine and i t s Cg-epimer with t h e b a s i c i t i e s of (-)-ephedrine and (+)-$-ephedrine.
z.
:$CH2
H$UH:I3 Ph ( - )ephedrine
( pKt3
9.14
Hl*N CH2
k l . H 3
-
H
Ph Q Q ( +)-%ephedrine ( - )quinine (+) epiquinine 9.22
7.73
8.40
553
QUININE HYDROCHLORIDE
The c o n f i g u r a t i o n of ephedrine (erythroc o n f i g u r a t i o n ) and $-ephedrine ( t h r e o c o n f i g u r a t i o n and t h e s t r u c t u r e of quinine and epiquinine have been drawn ( a s above) so t h a t comparison can be made for c8 and C 9 . Inspection of t h e pKa values shows t h a t JIephedrine i s a s t r o n g e r base t h a n ephedrine and t h a t epiquinine i s a s t r o n g e r base t h a n q u i n i n e , by a n a l o m , (+)-epiquinine i s t h e r e f o r e probably r e l a t e d t o (+)-$-ephedrine i n c o n f i g u r a t i o n and Thus, t h e con(-)-quinine t o (-)-ephedrine. f i g u r a t i o n s a t C 8 and C9 i n (-)-quinine and ( + ) epiquinine a r e probably t h o s e shown i n t h e above formulae. If t h e s e c o n f i g u r a t i o n s are accepted, then t h e r e l a t i v e c o n f i g u r a t i o n s a t C 3 , C 4 , c8 and Cg a r e now known. It i s now p o s s i b l e t o w r i t e t h e a b s o l u t e c o n f i g u r a t i o n s of t h e s e a l k a l o i d s . Lyle and Keefer ( l l a ) have confirmed t h a t t h e n a t u r a l cinchona a l k a l o i d s a r e a l l of t h e erythroc o n f i g u r a t i o n with r e s p e c t t o t h e i r C8 and C 9 systems.
HO --C
I
Q/H '
( - )quinine
H (+)quinidine
H--d Q '
,OH
epiquinine
epiquinidine
FARID J. MUHTADI E T A .
554
1.3.
Molecular Weight
396.88 ( d i h y d r a t e ) 360.88 (anhydrous )
1.4.
Elemental Composition C , 60.53%; H, 7.36%; N, 7.06%; 0 , 16.13%; C1, 8.92% ( d i h y d r a t e ) C, 0,
1.5.
66.57%; H, 6.98%; N, 7.76%; 8.87%; C 1 , 9.81% (anhydrous)
Appearance, C o l o r , Odor and Taste Fine c o l o r l e s s o r white s i l k y n e e d l e - l i k e c r y s t a l s , o f t e n grouped i n c l u s t e r s , o d o r l e s s , and has a v e r y b i t t e r t a s t e .
2.
Physical Properties 2.1.
Melting Range Quinine hydrochloride m e l t s a t : 145 - 153' ( 1 2 ) by hot s t a g e method ( 1 2 ) by h o t b a r method 162O 158 - 160° (13)
156 2.2.
2.3.
- woo
(8)
Eut ec t i c Tempera t u r e Phenacetin Benzanilide
100'
Phenacetin Benzanilide
106"
114'
118'
( 1 2 ) by h o t s t a g e method ( 1 2 ) by hot b a r method
Solubility One gram d i s s o l v e s i n 23 m l o f w a t e r a t 20°, i n 1 . 0 m l of a l c o h o l ( 9 6 % ), i n about 1 . 0 m l chloroform, i n about 7 . 0 m l g l y c e r o l and i n about 350 m l e t h e r .
2.4.
Loss on Drying When d r i e d t o c o n s t a n t weight a t 105O, l o s s e s 6.0 t o 10% of i t s weight ( u s i n g 2 . 0 g ) ( 1 4 ) .
555
QUININE HYDROCHLORIDE
2.5. pH Range 1% aqueous solution of quinine hydrochloride has a pH of 6.0 - 7.0.
2.6. Optical Rotation The following optical rotations were reported. [ a
,I
- 57.1 - 133.7 - 149.8 - 145.5 - 240 to
-
258
Solvent
Ref.
chloroform
(15)
water
(15)
1.3% in water 97% ethanol
(8) (15)
2% solution in 0.1 N hydrochloric acid
(13,14)
The specific rotation of quinine hydrochloride as 2% ethanolic solution has been determined by using a Parkin Elmer Polarmatic model 241 MC and found to be [ cy,]
2.7.
-144.25'
Spectral Properties
2.7.1
Ultraviolet Spectrum The UV spectrum of quinine hydrochloride in ethanol was scanned from 190 to 400 nm using DMS 90 Varian Spectrophotometer. It exhibited the following UV characteristics (Fig.1). Table 1 UV characteristics of quinine hydrochloride. X h x . at 205 232
277 321 332
E -
2381 2858 3334
Figure 1. The W Spectrum of Quinine Hydrochloride i n Ethanol
557
QUININE HYDROCHLORIDE
Other r e p o r t e d U.V. s p e c t r a l d a t a f o r quinine hydrochloride i n a l c o h o l ( 8 ) :-
Xmax. a t 278 nm (2512) and 331 nm (3236) and for quinine i n ethanol ( 1 6 ) :Xmax. a t 236 nm ( E 1%, 1 cm 1110), 278 nm ( E 1%, 1 cm 133) and 332 ( E 1%, 1 cm 1 6 3 ) . The UV absorption s p e c t r a of quinine and i t s hydrochloride s a l t i n o t h e r s o l v e n t s were also reported (16-18). 2.7.2
I n f r a r e d Spectrum The I R spectrum of quinine hydrochloride a s KBr-disc was recorded on a Perkin Elmer 580B I n f r a r e d Spectrophotometer t o which I n f r a r e d Data S t a t i o n i s a t t a c h e d (Fig. 2 ) . The s t r u c t u r a l assignments have been c o r r e l a t e d with t h e following frequencies (Table 2 ) . Table 2. I R c h a r a c t e r i s t i c s of quinine hydrochloride. Frequency cm
-1
Assignment
3300
OH bonded
2580 2960
NH ( q u i n u c l i d i n e ) CH s t r e t c h
1615 1600,1512,1480 1248,1230,1100,1030 860,838,808,725
+
CN [ C=C ( a l k e n e ) C=C (aromatic ) e t h e r linkage T r i subst it u t ed benzene
Other c h a r a c t e r i s t i c absorption bands a r e : 1438,1365,1345,1320,1140,1130,1010,990 , 935, cm-1. Other I R d a t a f o r quinine hydrochloride ( 8 ) and f o r quinine (16) have been a l s o reported. Hayden and Sammul (19) described t h e I R s p e c t r a of dimorphous and amorphous forms of quinine.
FIG. 2
THE
IR
SPECTRUM OF Q U I N I K E HYDROCHLORIDE A S KBR DISC.
559
QUININE HYDROCHLORIDE
2.7.3
Nuclear Magnetic Rosonance S p e c t r a 2.7.3.1
Proton S p e c t r a The PMR s p e c t r a of q u i n i n e hydroc h l o r i d e i n d e u t e r a t e d chloroform and d e u t e r a t e d d i m e t h y l s u l f o x i d e were recorded on a Varian T - ~ O A , 60-MH, NMR Spectrometer u s i n g TMS ( T e t r a m e t h y l s i l a n e ) as an i n t e r n a l r e f e r e n c e . These a r e shown i n Fig. 3 and Fig. 4 r e s p e c t i v e l y . The f o l l o w i n g s t r u c t u r e assignments have been made (Table 3). Table 3 PMR c h a r a c t e r i s t i c s of quinine hydrochloride
Group
Chemical S h i f t (ppm) CDC13
DMSO
D6
s = s i n g l e t , d = doublet, q = quartet m = m u l t i p l e t b s = broad s i n g l e t bd = broad d o u b l e t , 2d = doublet of d o u b l e t s , b t = broad t r i p l e t . Other PMR s p e c t r a l d a t a of q u i n i n e and i t s hydroc h l o r i d e d i h y d r a t e s a l t i n C D C l have been r e p o r t e d 3 (8, 2 0 ) .
4
560
m
J V
n
-z
u
W
ff a
0 I J
V
0
e n >
Y
L'
W
--.3
c
U
0
E
0 3
e
u
l-
W
a VY
of
E M
2 LL
FIG. 4 Hf'%
SPECTRUM OF k J l N l N E
HYDROCHLORIDE I N Dr;sO-Dg
FARlD J . MUHTADI ETAL.
562
2.7.3.2
13
C-NMR
13
C-NMR n o i s e decoupled and o f f resonance s p e c t r a are p r e s e n t e d i n F i g . 5 and Fig. 6 r e s p e c t i v e l y . Both were recorded over 5000 Hz width i n C D C l 3 ( c o n c e n t r a t i o n 52.9 mg/l ml) on J e o l FX-100 NMR Spectrometer, u s i n g a 1 0 mm sample t u b e and TMS as a r e f e r e n c e s t a n dard a t 20'. The carbon chemical s h i f t s are a s s i g n e d on t h e b a s i s of t h e a d d i t i v i t y p r i n c i p a l s and t h e o f f resonance s p l i t t i n g p a t t e r n (Table 4 ) .
Table 4. Carbon no.
Carbon Chemical S h i f t s of q u i n i n e hydrochloride.
Chemical s h i f t [ PPm 1
Carbon no.
Chemical s h i f t [ PPm 1
c6
158.12(s)
c5 c10
99.79 ( d ) 65.99 ( d )
c3
146.81( d ) 144.34(s)
c11
60.14 ( d )
c9
143.42(s)
c16
56.99 ( t )
r w
El
-1
0
a I
U
0
a
CI
t I
2
W
-z -z Q
0
LL
z 3 a I-
U W
n.
v)
n
W -I
0
3
n.
U
W
P L
v)
W
0
z
4
M
V
T
r
oc
4 In
2 LL
FIG. 6
13C-NMR
OFF RESONANCE SPECTRUM OF 3 U I N I N E
HYDROCHLORIDE.
QUININE HYDROCHLORIDE
565
‘18
137.37 ( d
c20
‘8
131.03( d )
C4
125.25(s) 122.17(d)
‘1 5
C
7
c2 C
19
118.81(d)
117 15( t
‘17 ‘13 52 ‘14
54.70 ( 9 ) 44.11( t ) 37.12( d ) 26.91( a ) 24.29( t ) 18.13( t )
s = s i n g l e t , d = doublet, t = t r i p l e t , q = q u a r t e t . Other 13C-NMR s p e c t r a l d a t a of qninine have been r e p o r t e d (21, 22).
2.7.4
Mass Spectrum The mass spectrum of quinine hydrochloride obtained by e l e c t r o n impact i o n i z a t i o n which w a s recorded on a Finnigan Model 3000 D GC-MS-system. The spectrum scanned t o mass 500 with u n i t r e s o l u t i o n . Electron energy was 7Oev. The chemical i o n i z a t i o n mass s p e c t r a l d a t a were obtained on a Finnigan Model 1015D GC Mass Spectrometer. Methane w a s used as GC c a r r i e r gas and a l s o served as t h e C I r e a c t a n t gas i n t h e i o n source. The i o n source temperature w a s 180Oc and e l e c t r o n energy 100 ev., i o n r e p e l l e r , 3V. E l e c t r o n impact mass s p e c t r a l d a t a : Base Peak 136
Fig. 7 (23).
42, 55, 67, 81, 95, 117, 128, 136, 158, 172, 1.89, 202, 222, 251, 269, 295, 309, M+ 324 C I mass s p e c t r a l d a t a and prominent fragment i o n s are M.H+ 325 (1001, 136 (371, 307 (101,and 323 ( 7 ) .
Fig. 7
The Mass Spectrum of Quinine
QUININE HYDROCHLORIDE
3.
567
P r e p a r a t i o n of Quinine h y d r o c h l o r i d e 3.1.
I s o l a t i o n of Q u i n i n e Quinine i s t h e p r i n c i p a l a l k a l o i d o f cinchona b a r k of which s e v e r a l s p e c i e s are known. Cinchona o f f i c i n a l i s L. ( C . l e d g e r i a n a Moens) , Family Rubiaceae i s t h e most important. It c o n t a i n s about 8% q u i n i n e ( 2 4 ) . Q u i n i n e w a s i s o l a t e d from cinchona b a r k by P e l l e t i e r and Caventou i n 1820 ( 2 5 ) . S e v e r a l methods have been r e p o r t e d f o r t h e i s o l a t i o n of q u i n i n e from cinchona b a r k , t h e most important method i s as f o l l o w s ( 2 6 ) : Powdered cinchona (250g) i s w e l l mixed w i t h C a O ( 6 0 g ) , water (600 m l ) and 30% NaOH s o l u t i o n ( 3 0 m l ) and l e f t f o r 24 hours. The mixture i s t h e n e x h a u s t i v e l y e x t r a c t e d under r e f l u x w i t h benzene. The benzene e x t r a c t i s f i l t e r e d while h o t i n t o a s e p a r a t i n g f u n n e l c o n t a i n i n g c o n c e n t r a t e d H2S04 ( 7 g ) i n water (500 m l ) t o convert t h e a l k a l o i d s t o t h e i r b i s u l f a t e s a l t s . The mixture i s s e p a r a t e d and t h e a c i d aqueous l a y e r i s h e a t e d t o 90' and n e u t r a l i s e d w i t h 5% Na2C03 s o l u t i o n u s i n g l i t m u s as an i n d i c a t o r (The b i s u l f a t e s a l t s are now converted i n t o t h e s u l f a t e s a l t s ) . The c l e a r orange s o l u t i o n becomes t u r b i d due t o t h e s e p a r a t i o n of some r e s i n o u s m a t e r i a l . D i l u t e H2SO4 ( 2 d r o p s ) and animal c h a r c o a l ( 2 g ) a r e added and t h e r e s u l t i n g mixture i s h e a t e d a g a i n a t 90' f o r 1 5 minutes and f i l t e r e d . The f i l t e r a t e i s allowed t o c o o l down when q u i n i n e s u l f a t e s e p a r a t e s o u t and c o l l e c t e d by f i l t e r a t i o n . The q u i n i n e s u l f a t e s o c o l l e c t e d i s d i s s o l v e d i n b o i l i n g w a t e r and t r e a t e d w i t h Na2C03 s o l u t i o n t o p r e c i p i t a t e q u i n i n e which i s c o l l e c t e d and c r y s t a l l i z e d . The procedure o u t l i n e i s p r e s e n t e d i n F i g . 8.
3.2.
Quinine Hydrochloride Q u i n i n e h y d r o c h l o r i d e i s o b t a i n e d by n e u t r a l i z i n g t h e a l k a l o i d quinine with d i l u t e hydrochloric a c i d and r e c r y s t a l l i s i n g from b o i l i n g w a t e r t o g i v e f i n e c o l o r l e s s c r y s t a l s of q u i n i n e h y d r o c h l o r i d e .
FARID J. MUHTADl ETAL.
568
+
Powdered cinchona
reflUX
CaO + NaOH with C6H6
+
Water
1
filter
Hot f ilt erat e
Extract
with d i l . H2S04
I
I f
Alkaloids b i s u l f a t e s
Heating a 90 O
+
Na2C03
(PH 6 . 5 )
Alkaloids s u l f a t e s
+
Purify
charcoal b o i l and f i l t e r
Cool f i l t e r a t e
+
F i l t e r a t e of
Quinidine cinchonine sulfates etc.
*
P r e c i p i t a t e of quinine s u l f a t e Na2S03
1
solution
Quinine
Fig. 8.
Procedure Outline f o r t h e I s o l a t i o n of Quinine.
QUININE HYDROCHLORIDE
569
4. Synthesis of Quinine 4.1.
Partial Synthesis Rabe and Kindler in 1918 (3) achieved the first partial synthesis of quinine from quinotoxine. Quinotoxine was converted by the action of sodium hypobromite into N-bromoquinotoxine which was cyclized by alkali with the l o s s of hydrogen bromide to give quininone. Reduction of the ketone with aluminium powder and ethanol in the presence of ethoxide gave a mixture of stereoisomeric alcohols from which quinine and quinidine were isolated. Gutzwiller and Uskokovic in 1973 (7) developed a slightly different scheme for the partial synthesis of quinine from quinotoxine. Quinitoxine was dissolved in dichloromethane and treated with sodium hypochlorite solution to give N-chloroquinotoxine. This was cyclized with phosphoric acid to give a mixture of quinone and quinidinone. The resulting mixture was dissolved in benzene and treated with a solution of diisobutylaluminium hydride in toluene to give a mixture of quinine and quinidine which was separated by crystallization.
4.2. Total Synthesis Several schemes (I to IV) for the total synthesis of quinine have been reported. The first total synthesis of quinine was completed in 1944 by Woodward and Doering (2). Rabe and Kindler (3) carried out a partial synthesis of quinine starting from quinotoxine. Woodward and Doering (2) completed the total synthesis by synthesizing (+)-quinotoxine. The first total synthesis of quinine is presented in Scheme I. m-Hydroxybenzaldehyde [l] is condensed with aminoacetal [2] to give 7-hydroxyisoquinoline [ 3 ] which is treated with formaldehyde in methanol containing piperidine to give 7-hydroxy-8-piperidinmethylisoquinoline [ 41. This by heating with methanolic sodium methoxide at 220° is converted
FARID J. MUHTADI ETAL.
570
into ~-hydroxy-8-methylisoquinoline[ 5 1. Compound [ 51 on catalytic reduction, followed by acetylation gives N-acetyl-7-hydroxy-8-methyl1,2,3,4-tetrahydroisoquinoline [6], which on further catalytic reduction by heating with a Raney nickel catalyst under pressure and then followed by oxidation with C r O 3 is converted into N-acetyl-~-keto-8-methyldecahydroisoquinoline[ T I . This compound is a mixture of cis-and trans-isomers, these are separated and the cis-isomer is treated with ethylnitrite in the presence of sodium ethoxide to give the homomeroquinene derivative [8]. This on reduction gives the corresponding aminocompound [g], which may now be written more conveniently as shown. Exhaustive methylation of [ 91 followed by hydrolysis gives t cis homomeroquinene [lo] which after esterification and benzoylation gives N-benzoylhomomeroquinene ethylester [ll]. On condensation of [ 111 with excess ethylquininate [lg] using sodium ethoxide produces the intermediate B-ketoester [20]. This on heating with hydrochloric acid is hydrolysed and decarboxylated to (+)-quinotoxine [21]. This is resolved via its dibenzoyltartrate. (+)-quinotoxine [ 221 which is converted into quininone [23] upon N-bromination and cyclization. Reduction of [23] with aluminium powder and ethanol gives a mixture of stereoisomeric quinine and quinidine [24]which are separated. Quinic acid required for the synthesis of quinine was prepared by Rabe et al. ( 27). panisidine [121 is condensed with acetoacetic ester [ 1 3 ] to give the condensate [14]. This is treated with sulfuric acid where ring closure occurs to give 2-hydroxy-4-methyl-6-methoxyquinoline [15]. The phenolic hydroxyl group of [15] is eliminated upon treatment with a mixture of phosphorous pentachloride and phosphorous oxychloride to give 2-chloro-4-methyl-6-methoxyquinoline [16] which upon hydrogenation gives 4-methyl6- methoxyquinoline [ 171. Knoevenagel condensation of the latter followed by oxidation gives quinic [l81 which upon esterification gives ethylquininate
[191
Scheme 11: Total synthesis of quinine and quinidine according to Uskokovic et al. (4).
QUININE HYDROCHLORIDE
Scheme I:
T o t a l S y n t h e s i s of Q u i n i n e (Woodward and Doering).
571
FARID J. MUHTADI ETAL.
572
H i) H p R a n e y N i i i ) ~r03
-G - IJCOCH3
0
CH3
I
i ) C H ON0
2 5
i i ) C H ONa
[71
Q c g L T
H5c$2c H2N-CH
CH3
[91
‘
QN=C C
11
HO C H 3
O
2 5
C
H
[81
3
QUININE HYDROCHLORIDE
( f )-Quinine
1241 ( f ) Quinidine
573
Resoln.
( - )-Quinine
[241 (+)Quinidine
FARID J . MUHTADI ETAL.
574
P'
ii)KMnOq
H
F
O
COOC2H5 d
' 3 " " 3
C6H5CH0
ester.
L
[191
[181
575
QUININE HYDROCHLORIDE
N-benzoylhexahydroisoquinolone [ 11 is hydrogenated with rhodium on alumina catalyst to give predominantly cis-isoquinolone [2] which is treated with sodium azide in poly-phosphoric acid to give a mixture of the seven-membered lactams which is separated by fractional crystallisation to give [ 31. Lactam [3] is treated with dinitrogen tetroxide to give the N-nitrosolactam [4] which is rearranged upon heating to the diazolactone [5] and fragmented with extrusion of nitrogen to give a mixture of racemic N-benzoylmeroquinene [6] and the seven membered lactone [?a] (in 50 and 30% yield, respectively). The latter [5a] can be converted into [6] which upon esterification gives N-benzoylmeroquinene methyl ester [6a]. This ester is treated with 6-methoxylepidyllithium [7] in tetrahydrofuran to give the racemic N-benzoylketone [8]. This is treated with diisobutylaluminium hydride in toluene at - 78O [route a] to remove the benzoyl group with concommitant reduction of the ketone function to give the aminoalcohol [g] The aminoalcohol [9] is first acetylated with acetic acid containing 10% boron trifluoride etherate and treated with boiling benzene - acetic acid - sodium acetate where cyclization proceeds to give a mixture of desoxyquinine and desoxyquinidine [12]. This can also be achieved without acetylation. The aminoalcohol [9] is refluxed with benzene - acetic acid mixture (4:l) for 4-5 days when cyclization proceeds via dehydration [ 111 to give both desoxyquinine and desoxyquinidine [12]. Upon stirring a solution of [12] in dimethyls u l f o x i d e - t - b u t y l a l c o h o l ( 4 :1) containing potassium t-butoxide in an atmosphere of oxygen affords a mixture of quinine [13] and quinidine [14]. Separation can be effected by a combination of crystallization and chromatography.
.
An alternative synthetic route [b] via the amino epoxide [lo] is as follows:N-benzoylketone [8] is converted into a mixture of diastereomeric N-benzoyl epoxides [lo a] by bromination followed by sodium borohydride reduction. Reductive debenzoylation of [lo a] with diisobutylaluminium hydride in toluene at - 78' furnished a mixture of diastereomeric amino-
FARID J. MUHTADI ETAL
576
Scheme 11:
T o t a l Synthesis (Uskokovic etal. 1
EtOH HC1 [21
N-0
i;' H '
c
L41
[3 0
N
I)I
R=H
[61
R=CH3 [ 6a 1
Ac6H5
c6H5
QUININE HYDROCHLORIDE
577
CHeLi
r
[6al
+
.
conden.
4
"71 0
A c6H5
H3C0
[81
H CO
3
191
578
FARID I. MUHTADI ETAL.
[91
[a1
L a c e t ylation
QUININE HYDROCHLORIDE
579
epoxides [lo]. Treatment of [lo] with tolueneethanol (19:l) at reflux for 12 hr. give quinine [13] and quinidine [14]. Separation is effected by preparative thin layer chromatography. Scheme 1II:Total synthesis according to Gates et al. ( 5 ) 6-methoxylepidine [ 11 is condensed with N-acetyl3-vinyl-4-piperidineacetic acid ester [ 21 to give the ketone [ 31. Reduction of [ 31 followed by dehydration of the resulting alcohol with acetic anhydride gives the intermediate [ 41. Saponification of the latter affords the secondary m i n e [5] Alkaline hydrolysis of [ 51 in aqueous alcohol under reflux, cyclization occurrs to give a mixture of desoxyquinine and its c8 epimer desoxyquinidine [ 61. Oxidation of the mixture [6] with oxygen in the presence of potassium t-butoxide and triphenylphosphine in dimethylformamide -t.-butyl alcohol introduces of the hydroxyl group at C9 giving the diasteromeric quinine and quinidine [ 73. The intermediate [4] can also be prepared by the Wittig reaction of quininaldehyde [8]with the quaternary phosphonium compound derived from the corresponding bromide obtained from meroquinene alcohol [g]. Scheme IV: Total synthesis according to Taylor and Martin (6) : 4-chloro-6-methoxyquinoline [l] is treated with 2 equiv. of methylenetriphenylphosphorane [ 21 to give [3]. This is condensed with N-acetyl-3(R)vinyl-4 (S)-piperidineacetaldehyde [ 41 to give the olefin [5]. Removal of the N-acetyl group in situ by hydrolysis followed by spontaneous intramolecular Michael addition to give a mixture of desoxyquinine and desoxyquinidine [6] which is converted by base-catalyzed hydroxylation to quinine [ 71 and quinidine [ 81. Other scheme for the total synthesis of quinine through the synthesis of homomeroquinene and quinotoxine is reported by Uskokovic et al. ( 7 ) .
FARID J . MUHTADI ETAL.
580
Scheme 111:
Total Synthesis (Gates e t a l . )
QUININE HYDROCHLORIDE
581
FARID J. MUHTADI ETAL.
582
Scheme I V : T o t a l S y n t h e s i s of Q u i n i n e (Taylor and M a r t i n )
c1
H 3 c 0+ y 3 CHO CH=PPh3
I
H3c000 +
[31
H3C0
H . .
conden.
COCH3
[41
-
\
583
QUININE HYDROCHLORIDE
5. Biosynthesis of Quinine Postulation of the biosynthetic pathway of cinchona alkaloids started in 1950 with the suggestion of Goutarel et al. ( 2 8 ) that quinine and other cinchona alkaloids are derived from indolic precursors, since cinchonamine (indole alkaloid) occurs as a minor alkaloid in cinchona. This was proved when Kowanko and Leete ( 2 9 ) have isolated labelled quinine upon feeding trypt0phan-2-~~C into cinchona plants. They have shown that the quinoline ring and Cg unit of quinine originated from tryptophan. Further studies have proved that quinine is biosynthesized by a combination of indolic and monoterpenoid units which leads to the corynanthe type indole alkaloids. Thus tryptophan ( 2 9 ) , geraniol (30-32) and loganin ( 3 3 ) were incorporated into quinine. Tracer experiments on Cinchona ledgeriana carried out by Battersby and Parry ( 3 4 ) have established the biosynthetic pathway of quinine as presented in scheme V. Scheme V:
Biosynthesis of Quinine
Loganin
Secologanin
+
p)-JyOH \
H
Tryptophan
Vincoside
-
FARID J. MUHTADI ETAI;.
584
LHO
Corynantheal
-
Cine honaminal
I
H
I
H
k
585
QUININE HYDROCHLORIDE
Quinidine
FARID J . MUHTADI ETAL.
586
6. Metabolism The cinchona alkaloids are extensively metabolized in the body, especially in the liver, so that less than 5% of an administered dose is excreted unaltered in the urine (35-37). The metabolism of quinine has been studied both in human and rat urines. The major urinary metabolites in man are hydroxyderivatives of quinine (37). The route of quinine metabolism in man proposed by Brodie et al. (37)involves two parallel pathways as presented in the f o l l o w i n g scheme. Scheme VI: Metabolism of quininein Man
\
H3CO
dihydroxy derivative (non-phenolic)
quinine carbostyri1
QUININE HYDROCHLORIDE
587
Barrow et al. (38) have separated eight metabolites of quinine in the urine of male Sprague-Dawley rats after Six of which have a single dose of quinine (50 mg/Lg). been identified as O-desmethylquinine, hydroxyquinine, quinine, quinine carbostyril and the two diastereoismers of quinine-10, ll-dihydrodiol. These were separated by reversed-phase HPLC on a semi-preparative column by gradient elution. Separation of these metabolites is presented in Fig. 12.
7.
Pharmacokinetics Quinine is readily absorbed after oral administration. Absorption occurs mainly from the upper small intestine, and is almost complete even in patients with marked diarrhea. Rectally administered doses are poorly absorbed and intramuscular or subcutaneous doses of quinine salts are slowly absorbed (13, 35). Peak plasma concentration of quinine occurs within 1 to 3 hours after a single oral dose (35). Therapeutic plasma concentrations appear to be in the range 3 to 7 ug/ml during therapy with oral doses of 500 to 650 mg thrice daily (13). Malarial infection inhibits hepatic metabolism and thus plasma concentrations resulting from a given dose will vary according to the severity of the infection (391. Plasma half-life 6-9 hours, which is increased up to 1 5 hours in malarial infection and decreased to about 3 to 4 hours in patients being treated with antiepileptic drugs (39). After termination of quinine therapy, the plasma level falls rapidly and only a negligible concentration is detectable after 24 hours. A large fraction (approximately 70%) of the plasma quinine is bound to proteins (35). Quinine is excreted mainly in the urine, but small amounts also appear in the feces, gastric juice, bile and saliva. Renal excretion of quinine is twice as rapid when the urine is acidic as when it is alkaline (35).
8. Indications and Dosages
8.1. For the Treatment of Malaria The usual oral dose of quinine or its salts is 325 mg four times daily for 7 days. The drug is given after meals, preferably in capsules, to
FARID J. MUHTADI E T A .
588
minimize gastric irritation (35). Intravenous injections of quinine are to be reserved for certain emergencies such as pernicious or cerebral malaria. The dihydrochloride is employed and I.v. injection should be given very slowly, preferably by the drip method (35). 8.2.
For the relief of Nocturnal Leg Cramps Recumbency leg muscle cramps (night cramps) are quickly and effectively relieved by quinine in most cases. The dose is 200 to 300 mg before retiring (35).
9.
Toxicity Poisoning by quinine is usually due to clinical overdosage or to hypersensitivity. The fatal oral dose of quinine for adults is approximately 8 g (35). When quinine is repeatedly given in full doses a typical cluster of symptoms occurs to which the term cinchonism has been applied. In its mildest form it consists in ringing in the ears, headache, nausea, and slightly disturbed vision. When medication is continued or after large single doses, symptoms also involve the gastrointestinal tract, the nervous and cardiovascular systems and the skin (35).
QUININE HYDROCHLORIDE
589
10. Methods of Analysis 10.1.
Identification
10.1.1 Color Tests The following c o l o r t e s t s have been described f o r t h e i d e n t i f i c a t i o n of quinine , H C 1 (12-14, 40 -44 ) : a. Dissolve 1 0 mg i n s u f f i c i e n t water t o produce 10 ml and t o 5 m l of t h e s o l u t i o n add 0.2 m l of bromine water and t h e n 1 m l of 2 M ammonia, an emeraldgreen c o l o r i s produced. b . Dissolve 5 mg i n 5 ml of water, add 1 ml of 2 M ammonia and 5 ml of e t h e r , shake and acidif'y with 2 M n i t r i c a c i d , t h e aqueous l a y e r y i e l d s r e a c t i o n s c h a r a c t e r i s t i c of chlorides. c . Quinine a l k a l o i d can be i d e n t i f i e d w i t h ammonium t e t r a k i s ( t h i o c y a n a t o ) z i n c a t e ( 4 2 ) . d. I n t o x i c o l o g i c a l work, it i s o f t e n d e s i r e d t o d e t e c t very s m a l l q u a n t i t y of quinine. A very s e n s i t i v e t e s t has been r e p o r t e d (45).
10.1.2 Micro-Crystal T e s t s The following micro-crystal t e s t s a r e a l s o u s e f u l i d e n t i f i c a t i o n t e s t s , photomicrographs of t h e c r y s t a l s have been described (16, 46-49) (Fig. 9 and 1 0 ) . i ) Platinic
iodide s o l u t i o n g i v e s curved s e r r a t e d needles ( s e n s i t i v i t y 1 i n 1 5 0 0 ) .
i i ) Sodium phosphate s o l u t i o n forms needles ( s e n s i t i v i t y 1 i n 1000). iii) Dissolve 1 mg i n 2 ml of water, a c i d i f y with d i l u t e s u l p h u r i c a c i d (1 drop) and add a few drops of an aqueous s o l u t i o n c o n t a i n i n g 5% of cadmium i o d i d e and 10% of potassium i o d i d e . Colorless c r y s t a l s a r e produced and t h e s o l u t i o n becomes t u r b i d .
FARID J. MUHTADI ETAL.
590
F i G , 9,
MICROCHEMICAL CRYSTALS WITH DISODIUM HYDROGEN
OF Q U I N I N E PHOSPHATE,
F I G . 13. K I C R C C H E M I C A LCRYSTALS EETHYL I O D I D E .
HYDRCCHLORIDE
OF ~ U I P J I NWEI T P
QUININE HYDROCHLORIDE
591
i v ) A drop of t h e drug i s p u t on a microscope s l i d e next a drop of an almost s a t u r a t e d s o l u t i o n of p i c r i c a c i d o r of 3 $? g o l d c h l o r i d e , covered and observed f o r 1 5 minutes or more. If t h e p i r r a t - e ( o r a u r a t e ) does n o t c r y s t a l l i s e spontaneously, a s m a l l amount o f a suspension of f i n e s e e d c r y s t a l s i s added t o one edge of t h e drop and i t s e f f e c t observed. I d e n t i f i c a t i o n of q u i n i n e i n human u r i n e h a s been d e s c r i b e d (48) by t h e f o l l o w i n g method :
v)
A f t e r a c i d h y d r o l y s i s t o f r e e t h e b a s e from i t s g l u c u r o n i d e , q u i n i n e i s e x t r a c t e d from a l k a l i n e s o l u t i o n by chloroform. The s o l v e n t i s evaporated and t h e r e s i d u e , d i s s o l v e d i n methanol, i s s u b j e c t e d t o TLC. The p l a t e i s sprayed w i t h i o d o p l a t i n a t e , and t h e methanolic e x t r a c t o f t h e s p o t i s t h e n subjected t o s p e c i f i e d microscopical tests. The product i s i d e n t i f i e d by t h e c r y s t a l formed.
10.2.
Gravimetric Method B e r l i n and Robinson (50) have d e s c r i b e d a thermog r a v i m e t r i c d e t e r m i n a t i o n of q u i n i n e w i t h d i l i t u r i c a c i d . S o l u t i o n of q u i n i n e i n 50% e t h a n o l w a s t r e a t e d w i t h 0.02 M d i l i t u r i c a c i d i n 40% methanol s o t h a t t h e molar r a t i o of d i l i t u r i c a c i d t o q u i n i n e was approximately 7 : l . The p r e c i p i t a t e w a s washed w i t h c o l d 50% Ethanol s a t u r a t e d w i t h d i l i t u r i c a c i d followed by c o l d 95% e t h a n o l and t h e n d r i e d A i n t h e thermobalance between 140° and 195'. c o n s t a n t weight w a s o b t a i n e d i n 1 5 t o 20 m i n u t e s , corresponding t o anhydrous q u i n i n e d i l i t u r a t e . Amounts of q u i n i n e between 2 and 40 mg have been determined w i t h a maximum d e v i a t i o n of 3%.
lo.3.
T i t r i m e t r i c Methods 10.3.1
Aqueous Schneider ( 5 1 ) has p u b l i s h e d t h e a p p l i c a b i l i t y o f t h e s t r o n g l y b a s i c anion-exchangers t o t h e d e t e r m i n a t i o n of q u i n i n e , H C 1 and
FARID J. MUHTADI ETAL.
592
quinine ,H2SO4. In this method , the salt (about 0.1 gm) is dissolved in 90% ethanol (10 ml) , pass the solution through an anionexchange resin. Pass 90% ethanol (10 ml) through the column, then rapidly pass a further 20 ml. Dilute the combined percolates with freshly boiled, cooled water (50 to 70 m l ) and titrate the liberated mine with 0.1 N HC1 in the presence of Tashiro’s indicator, until the green-blue colour changed to violet (52). 10.3.2 Non-Aqueous Non-aqueous titration methods have been described for the analysis of quinine alkaloid or salt ( 53-59). The drug is titrated by perchloric acid in acetic acid and the end point is determined potentiometrically. The method is applied for the determination of small amounts of the alkaloid in the presence of an adsorption electrode ( 60). Quantitation of quinine in media of nitromethane and of chloroform-dioxane has been also reported (61) 10.3.3
Complexometric Application of volume-colorimetry to the micro-determination of alkaloids, including quinine, has been described (62). The assay method depends on the precipitation of the alkaloid with phosphotungstic acid reagent, the precipitate is treated with a reducing agent, the blue color of tungstic anhydride is titrated volumetrically with an oxidising agent. MaJlat and Bayer (63) have also reported the determination of quinine salts by titration with tungstosilicic acid. Complexometric determinations of alkaloids, including quinine, have been also described, by the use of EDTA (disodium salt) (64) or copper picrate (65). Budesinsky and Vanickova (66) have published a complexometric titration of quinine. The
QUININE HYDROCHLORIDE
593
drug i s p r e c i p i t a t e d a t pH 1 . 2 t o 1.5 w i t h bismuth potassium i o d i d e , and t h e excess of t h e reagent i s determined as b i s muth complexometrically. have described t h e Yeh and Tsang (67) q u a n t i t a t i o n of q u i n i n e , H SO4 by c a t i o n 2 exchange followed by complexometric t i t r a t i o n . The e r r o r i s 0.5-2%.
10.3.4
Conductimetric High-frequency t i t r a t i o n of q u i n i n e , HC1,quinine,H2S04, a n d o t h e r s a l t s of organic compounds , has been r e p o r t e d (68). Graphs i l l u s t r a t i n g t h e high-frequency conductimetric t i t r a t i o n of t h e s e s a l t s have been described. For quinine, H C 1 , t h e t i t r a n t i s 0.01 N s i l v e r n i t r a t e ; for quinine,H$O4, t h e t i t r a n t i s 0 . 0 1 M barium c h l o r i d e , 0.01 M barium a c e t a t e , or 0.008 N potassium hydroxide. I n t h e t i t r a t i o n of q u i n i n e , H2S@4with potassium hydroxide, e x t r a p o l a t i o n i s necessary t o determine t h e p o i n t of i n f l e c t i o n of t h e graph.
10.3.5
Amperometric Lemahieu e t a l . ( 6 9 ) have r e p o r t e d an aniperometric determination of q u i n i n e , H C 1 i n dimethyl sulphoxide. The method i s based on t i t r a t i o n w i t h s i l v e r n i t r a t e i n dimethyl sulphoxide t o give an end-point corresponding t o t h e formation of AgC1; and a less sharp end-point f o r t h e p r e c i p i t a t i o n of s i l v e r c h l o r i d e . U s e of t h e f i r s t end-point and two platinum i n d i c a t o r e l e c t r o d e s with a p o t e n t i a l d i f f e r e n c e of 100 mV allows t i t r a t i o n down t o a 0.2 m M c o n c e n t r a t i o n of q u i n i n e , HCI.. Use of one i n d i c a t o r e l e c t r o d e and a s i l v e r - Ag+ r e f e r e n c e e l e c t r o d e prodcces a l e s s sharp end-poir,t, not obtaina b l e below a m M concentration. Gengrinovich e t i z l . ( 7 0 ) have described t h e use of i o d i n e ch1ori.de and a r o t a t i n g platinum e l e c t r o d e for t h e amperometric t i t r a t i o n c f quint.ne, HC1. The t i t r a t i o n
FARID J. MUHTADI ETAL.
594
i s based on t h e a d d i t i o n o f I C 1 t o t h e v i n y l group of q u i n i n e . The r e a c t i o n i s complete i n 20-25 minutes. Charles and Knevel (71) have p u b l i s h e d coulometric a s s a y of q u i n i n e s u l p h a t e u s i n g an arseno-amperometric end-point d e t e c t i o n t e c h n i q u e . T h i s i s based on t h e f a c t t h a t t h e r e a c t i o n of bromine w i t h q u i n i n e s u l p h a t e i s t o o slow t o allow d i r e c t coulometric t i t r a t i o n of t h e drug. The c o e f f i c i e n t of v a r i a t i o n i s 0.5%.
10.3.6 Polarographic Souckova and Zyka(72,73) have r e p o r t e d a polarographic d e t e r m i n a t i o n of q u i n i n e , H C l by t i t r a t i o n with t u n g s t o s i l i c i c a c i d , tungstophosphoric, and molybdophosphoric acids (73). The a p p a r a t u s h a s a dropping mercury cathode and S.C.E. anode, t h e v o l t a g e b e i n g 0.65V. The pH o f t h e s o l u t i o n i s a d j u s t e d w i t h HC1. The m a x i m u m e r r o r i s f 1% w i t h t u n g s t o s i l i c i c a c i d and 22% w i t h t h e two o t h e r a c i d s . Molnar and Molnarwa (74) have d e s c r i b e d o s c i l l o p o l a r o g r a p h i c d e t e r m i n a t i o n of q u i n i n e a l k a l o i d . The o s c i l l o p o l a r o g r a p h i c behaviour of q u i n i n e d e r i v a t i v e s has been s t u d i e d and t h e i r oscillograms i n N LiC1, N LiCH, N NaOH, and N H$O4 were o b t a i n e d w i t h t h e u s e of dropping and streaming mercury e l e c t r o d e s . Concentration of 10-4 M s o l u t i o n of q u i n i n e a l k a l o i d s can b e d e t e c t e d with t h e use of o s c i l l o p o l a r o g r a p h i c methods. Q u a n t i t a t i v e o s c i l l o g r a p h i c polarography of c e r t a i n a l k a l o i d s , including quinine alkal o i d , have been a l s o r e p o r t e d Cinchona a l k a l o i d s g i v e c h a r a c t e r i s t i c o s c i l l o g r a m s which can b e used f o r t h e i r d e t e r m i n a t i o n with an accuracy of f 4%. Girard and R o u s s e l e t ( 7 6 ) have p u b l i s h e d a polarographic and c o l o r i m e t r i c d e t e r m i n a t i o n o f q u i n i c i n e i n t h e presence G f l a r g e amount of q u i n i n e .
QUININE HYDROCHLORIDE
595
1 0 . 4 . Chromatographic Methods
Chromatographic methods have been d e s c r i b e d f o r t h e s e p a r a t i o n , i d e n t i f i c a t i o n and q u a n t i t a t i o n of q u i n i n e i n pharmaceutical dosage forms and i n mixtures (77-93).
10.4.1
Paper Chromatography The f o l l o w i n g s c r e e n i n g procedure h a s been reported ( 9 4 ) f o r detecting quinine i n chemical-toxicological analysis of b io lo g ic a l m a t e r i a l (blood): To t h e blood ( 5 m l ) add water ( 3 1 . 5 m l ) and 10% Na2W04 s o l u t i o n (10 m l ) , mix, and add s l o w l y , w i t h s t i r r i n g , 10% H2S04 (3-5 m l ) . Heat t h e mixture i n a b o i l i n g - w a t e r b a t h for 10 minutes, f i l t e r , shake t h e cooled f i l t r a t e w i t h e t h e r (30 ml) , and d i s c a r d t h e e t h e r . Adjust t h e aqueous phase t o pH 9 w i t h c o n c e n t r a t e d aqueous ammonia, shake t h e s o l u t i o n with e t h e r ( 3 0 m l ) , d r y t h e e t h e r w i t h anhydrous sodium s u l p h a t e , e v a p o r a t e a t 37' i n a stream o f n i t r o g e n . D i s s o l v e t h e r e s i d u e i n one o r two drops of chloroform, apply t h e s o l u t i o n t o Whatman CT30 anionexchange paper, and c a r r y o u t ascending chromatography w i t h 0 . 1 M EDTA f o r 1 4 minutes. Examine t h e w e t paper i n UV l i g h t a t 254 nm.
R a m a and Singh (83) have p u b l i s h e d a r a p i d s e p a r a t i o n of q u i n i n e , and o t h e r a l k a l o i d s , by ascending paper chromatography on s t r i p s impregnated w i t h 0 . 1 M zirconium o x y c h l o r i d e by u s i n g aqueous s o l v e n t s c o n t a i n i n g 0.001 N H C 1 o r 0.001 N NaOH. The i n d i v i d u a l a l k a l o i d , 4 a l k a l o i d s , were as w e l l as mixtures o f s e p a r a t e d w i t h i n 15-20 minutes. Q u i n i n e and s e v e r a l o t h e r a l k a l o i d s have been s e p a r a t e d by u s i n g Whatman No. 1 paper which h a s been soaked i n S o r e n s e n ' s phosphate b u f f e r s o l u t i o n ( M / l 5 , pH 5 ) and d r i e d , w i t h b u t a n o l as t h e mobile phase. The s p o t s a r e l o c a t e d by s p r a y i n g w i t h i o d o p l a t i n a t e r e a g e n t ( 91 )
.
5%
FARID J. MUHTADI ETAL.
S t r e e t and Niyogi (95) have r e p o r t e d a new technique of chromatography and ionophoresis on ion-exchange paper. This has been a p p l i e d t o s e p a r a t i o n of a mixture of compounds including quinine. The mixture i s subjected t o ascending chromatography i n 0 . 1 M - EDTA on diethylaminoethylcellulose paper f o r 20 minutes and s u b j e c t t o ionophoresis a t a constant c u r r e n t of 1 0 m A f o r 30 minutes. Steger and Storz (96) have described microa n a l y t i c a l determination of a l k a l o i d s , including quinine, with paper chromatogram soaked with molybdosilicic a c i d . A f t e r drying with w a r m a i r , e x t r a c t with a reducing q u i n o l , sodium carbonate, and sodium s u l p h i t e . The e x t i n c t i o n of t h e b l u e s o l u t i o n i s measured c o l o r i m e t r i c a l l y a t 660 nm.
A l w a s e t a l . (88) have r e p o r t e d t h e s e p a r a t i o n and q u a n t i t a t i v e a n a l y s i s of quinine, and o t h e r a l k a l o i d s , by a p p l i c a t i o n of paper ionophoresis. Jakube e t a l . have described t h e use of paper chromatography i n t h e assay o f m i x t u r e s of pharmaceuticals, including quinine s a l t s . I n t h i s method, mixtures of water, low-boiling a l c o h o l (methanol, ethanol , o r isopropanol) , and ammonia have been found t o be t h e b e s t s o l v e n t s , and a mixture of FeC13 w i t h K 3 Fe (CN)6, t h e b e s t d e t e c t i n g agent. Quinine (0.005 t o 0.015 mg) , and some o t h e r a l k a l o i d s , have been d e t e c t e d i n s e v e r a l foods by using a paper-chromatographic method (98). I n t h i s method, e t h a n o l i c e x t r a c t i s s u b j e c t e d t o descending technique on Whatman N o d paperand development i s achieved by chloroform. A f t e r drying, t h e chromatogram i s sprayed with potassium iodoplatinate.
QUININE HYDROCHLORIDE
597
10.4.2 Thin-Layer Chromatography The TLC analysis of cinchona alkaloids has been thoroughly reviewed by Verpoorte , et a1 ( 7 9 ) . From the TLC systems described in the review, 18 solvent systems were found to be the most suitable for the separation of the 24 Cinchona alkaloids. Table 5 shows the 18 solvent systems used f o r quinine. Table 6 quinine.
describes TLC detection techniques for
The sensitivity of a number of separation methods has been described. Some general conclusions concerning the optimal conditions for specific separations are also described Oswald and Fluck (86) have reported separate determination of cincho.naalkaloids by TLC. Quinine, quinidine, and cinchonine are separated on silica gel G. , with benzene-ethyl ether diethylamine (20:12:5) as solvent; cinchonidine migrates with quinidine. The alkaloids are identified with Dragendorff reagent. The spot area, measured by planimeter, is directly proportional to the amount of alkaloid in the range of 3 to 4 p g. The limit of error is ?: 8%. Bralinova ( 7 7 ) has described 6 eluent systems in the separation of quinine and quinidine on silica gel, using chloroform-acetone-diethylamine (20:20:1) as solvent. Schwarz and Sarsunova (87) have published thin layer chromatographic data for 27 alkaloids, including quinine , on aluminium oxide. The most useful solvents are: benzene-ethanol; chloroformethanol; and ethyl ether-ethanol. Sarsunova and Hrivnak (114) have reported the separation and evaluation of cinchona alkaloids by TLC, on silica gel -254 with chloroform-acetonediethylamine (5:4:1) as solvent.
Table 5
TLC Techniques Used for Quinine
Solvent System
-
fn 00
RF ( RFxlOO )
1.
Chloroform-diethylamine ( 9 :1)
2.
Chloroform-methanol - 25% ammonia (85 :14:1)
3.
4.
Chloroform-acetone ethanol) (5:4:1)
5.
Ref.
Chloroform-acetone-diethylamine (5:4:1)
17 44 17
59 60 61
-
21
39
Chloroform-acetone-methanol -25% ammonia (60 :20 :20 :1)
37
61
6.
Chloroform-ethylacetate-isopropanol-diethylamine ( 2 0 :70:4 :6 )
11
7. 8.
Chloroform-dichloromethane-diethylamine (20:15:5)
22
Dichloromethaqe-diethyl ether -diethylamine (20:15:5)
23
9.
Kerosene-acetone-diethylamine (23:9 :9)
32
39 39 39 62
( 3 m l 25% ammonia + 17 m l absolute
10. Acetone - 25% ammonia (58:2) 11. Ethyl acetate-isopropanol
-
25% ammonia (45:35:5) 12. Toluene-ethyl acetate - diethylamine (7:2:1) 13. Toluene-ethyl acetate-diethylamine (10:10:3) 1 4 . Toluene-diethyl ether-diethylamine (20:12:5) 15. Toluene-diethyl ether-dichloromethane-diethylam-ine (20 :20 :20 :8)
16. Carbon tetrachloride-n-butanol-methanol-10% ammonia
18 18
39 39 63 39 64
20
65
-
39
32
49 12
(12 :9:9:1)
Solvent System 17.
Cyclohexanol diethylamine
- cyclohexane-n-hexane
18. Methanol-25% ammonia (100:1 )
(1:l:l)
+ 5%
41
66
45
61
Conditions : Silica gel plates Si 60 F 254 pre-coated aluminum sheets, 20x20 cm (Merck); temperature, 2422'; relative humidity, 2525%; normal chromatography chamber, saturated for 30 minutes before use
Table 6
TLC Detection of Quinine
Reagent
1.
Quenching, 254 nm
2.
Fluorescence 360 nm (formic a c i d o r s u l p h u r i c a c i d spray)
3.
4. 5. 6.
Background Color
Color
Ref.
39 Light b l u e
39
Orange-red Orange-red Brown
39 67 67
Vaguj f a l v i Bregoff-Delwiche
Yellow Light-yellow Light -yellowwhite Light -yellow Light -yellow
Orange Orange
39 39
Iodine vapour
Yellow-white
Brown
Iodine i n K I
White
Brown
Iodine i n methanol
Light -yellow
Brown
39 68,69 60
Dragendorff's modification: Munier - Macheboeuf Munier Munier-sodium n i t r i t e
-
-
7.
Iodine i n K I and s i l v e r a c e t a t e
8.
F e r r i c c h l o r i d e , iodine i n K I
Light greenyellow
Brown
70 71
9.
Iodoplat i n a t e
Dark v i o l e t
Violet
39
10.
Iodoplatinate, a c i d i f i e d
Dark v i o l e t
Violet
72
Light greenblue
Dark green blue
45
11. F e r r i c hexacyanoferrate
Background Color
Reagent
Color ~
12.
F e r r i c chloride-perchloric
13.
14.
Methyl orange Tetraphenylborate
15.
Phenothiazine, i o d i n e vapor
16.
Phenothiazine vapor )
acid
quercetin
Ref.
~~~
Yellow-white
Violet
39
Light orange
Orange
73
i n UV:blue
74
Violet
Brown
60
Violet
Light brown
60
-
bromine vapor (ammonia
FAFUD J. MUHTADI ETAL.
602
Suchocki e t a l . (115) have r e p o r t e d determination of quinine, H C 1 and o t h e r compounds, by TLC, on a s i l i c a g e l with one of s e v e r a l solvent systems. The s p o t s a r e l o c a t e d with conventional reagents and are evaluated d e n s i t o m e t r i c a l l y . Hashmi e t a l . (85) have described semi-quantitative determination of quinine by c i r c u l a r TLC. Thirteen a l k a l o i d s , i n c l u d i n g quinine , have been separated i n t o groups by an e x t r a c t i o n scheme with t h e use of water, chloroform and ethanol solvent systems. Aliquots of t h e various e x t r a c t s ( c o n t a i n i n g 0 . 1 t o 7.0 pg of t h e a l k a l o i d ) a r e a p p l i e d t o a l a y e r of s i l i c a g e l f o r chromatographic a n a l y s i s .
The following method has been described f o r d e t e c t i n g quinine i n t o x i c o l o g i c a l a n a l y s i s of b i o l o g i c a l materials. The sample of u r i n e ( 1 0 m l ) , b u f f e r e d a t pH 9.5 i s e x t r a c t e d with chloroform-isopropyl alcohol (24:l). A c o n t r o l sample of u r i n e c o n t a i n i n g quinine ( 1 0 Ug/10 m l ) i s a l s o e x t r a c t e d . The solvent l a y e r i s f i l t e r e d , b o i l e d t o remove ammonia, and a c i d i f i e d with 0.1 N HC1. The solvent i s evaporated and t h e r e s i d u e i s d i l u t e d with methanol. The s o l u t i o n i s then a p p l i e d , i n p o r t i o n s , t o s i l i c a g e l G and t h e chromatograms a r e developed w i t h ethanol-methanolconcentrated ammonia (17:2:1) as t h e solvent. The a i r - d r i e d p l a t e i s heated a t 75' f o r 10 minutes, t h e n sprayed w i t h i o d o p l a t i n a t e and Dragendorff reagents
.
D i f f e r e n t i a t i o n of quinine from i t s oxidation products has been i n v e s t i g a t e d ( 9 2 ) . A s e n s i t i v e d e t e c t i o n reagent f o r quinine on t h i n - l a y e r chromatogram has been a l s o described ( 9 3 ) . Small amounts of quinine can be separated from impure samples and b i o l o g i c a l materials by chromatographic procedures.
Fig. 11 GLC of Quinine Hydrochloride
QUININE HYDROCHLORIDE
10.4.3
603
Gas-Liquid Chromatography A GLC method f o r t h e determination of quinine, H C 1 has been c a r r i e d out i n our l a b o r a t o r y , using a Varian GC-3700 gas chromatograph equipped with Varian CDS 111 integrator. Column conditions: 3%OV-17 on chromosorb W-Hp (80-100mesh s i z e ) ; g l a s s column ( 2 m x 2 mm). The column run isothermally a t 280' f o r 1 0 minutes and then t h e temperature was programmed a t 10°/minute. Carrier gas : helium, flow r a t e w a s a d j u s t e d t o 25 m l / minute. Detector : FID, hydrogen and a i r flow r a t e s were a d j u s t e d t o 30/minute and 300 ml/minute, r e s p e c t i v e l y . Ethanol was used as t h e solvent and t h e c h a r t speed w a s a d j u s t e d t o give 1 cm/minute. The r e t e n t i o n t i m e = 13.4 minutes. The GLC of quinine, H C 1 i s presented i n Figure 11. Sarsunova and Hrivnak ( 1 1 4 ) have described q u a n t i t a t i v e determination of quinine , and o t h e r cinchona a l k a l o i d s , by e x t r a c t i o n of t h e s p o t s from t h e TLC p l a t e s followed by GLC. The a l c o h o l i c s o l u t i o n , containing codeine as an i n t e r n a l standard, i s analysed by GLC on a column of 2% of OV-17 on AW Gas-Chrom p. The method i s s p e c i f i c enough f o r r o u t i n e drug a n a l y s i s . A gas-liquid chromatographic procedure has been a l s o r e p o r t e d (120) f o r t h e determinat i o n of s e v e r a l b a s i c drugs, i n c l u d i n g quinine, i n s m a l l blood samples. Bonini, e t . a1 (121) have described gasphase chromatographic determination of four a n t i m a l a r i a l s , including quinine, s i n g l y and i n a mixture i n blood and u r i n e . I n t h i s method, a column packed w i t h . 2% OV-17 on Chromosorb W AW DMCS 100-120 mesh with N gas as t h e c a r r i e r gas and t h e column temperature programmed t o i n c r e a s e from 250 t o 350' a t 8O/minute. The l i m i t of d e t e c t i o n was 0.52 ng f o r quinine. The r e c o v e r i e s i n blood and u r i n e were 84.3 and 92.8% f o r 1 i.lg q u i n i n e / l m l .
604
FARID J . MUHTADI ETAL.
10.4.4
Hioh Performance Liquid Chromatography Quinine has been determined among other cinchona alkaloids by HPLC. A number of HPLC assay procedures for quinine and its impurities have been described (82). Pound and Sears (122) have used a silica gel column with a tetrahydrofuran-ammonium hydroxide mobile phase to analyse quinine in commercial formulations. Low and Kennedy (82,123) have described ion-pair reversed-phase chromatography in surveying the quinine products available in Australia. Table 7 sununarises the solvent systems used in the cited references. Barrow et al. (38) have reported HPLC separation and isolation of quinine metabolites in rat urine. The extract was evaporated under N, and a solution of the residue in methanol was analysed on a column of IJ Bondapak Cl8 and detection at 254 nm. Eight metabolites of quinine were separated and only 6 were identified. These were separated on either an analytical or a semi-preparative reversed-phase column by gradient elution (Fig. 12). HYDROXYQUININE+
I
QUININE-10,llDIHYDRODIOLS
I 1
0
I
10
,
20
30
40
0-DESMETHYLQUININE
J
lPiNINE -CARBOSTYRIL
1
50
60
70
min.
Fig. 12 HPLC Separation of Quinine Metabolites
Table System No.
7.
HPLC Systems of quinine
Column
Mobile phase
Merckosorb Si 60
Chloroform-methanol (8:2)
6.4
(7:3)
5.9
Diethyl ether-methanol (8:2)
3.9
(7:3)
2.7
(6:4)
2.2
Retention Time (minute)
Methanol-water-acetic acid (25:75:1)
-
4 Silica gel
Diethylether-waterdiethylamine
-
Li Chrosorb Si 60
Chloroform-isopropyl alcohol-diethylamine-wat r (940:57 :1:2.62)
-
Li Chrosorb Rp-8
Water-acetonitrile (1:3); adjusted to pH 3 with perchloric acid
A reversedphase, u Bondapak
‘18
-
Detect ion
Ref.
W , 254 and 280 nm.
80
W, 254 nm.
a2
-
124
W, 312 nm.
125
250 nm or
126
435 nm.
FARID J. MUHTADI ETAL.
606
A study of t h e r e t e n t i o n behavior of quinine, and some o t h e r b a s i c drug substances, by ion-pair HPLC has been described By appropriate adjustment of expe(127). rimental parameters, complex separations can be achieved.
Jeuring e t a l . (126) have reported a r a p i d determination of quinine and i t s hydrochloride i n s o f t drinks and t o n i c water by reversed-phase ion-pair chromatography. I n t h i s assay method, quinine i s determined i n t h e concentration range of 20-100 mg and recoveries ranged from 97 t o 103%. 10.5.
Spectroscopic Methods 10.5.1
Colorimetric Hasselmann (128) has reported a microdetermination of quinine i n serum by means of t h e colored compound formed with Rose bengal. The method i s s u i t a b l e f o r determining concentration up t o 1 mg per 100 ml. The reported method i s as follows: To serum (10 m l ) add 20% t r i c h l o r o a c e t i c a c i d ( 5 ml), shake and centrifuge. Adjust an a l i q u o t (10 ml) of f i l t r a t e t o pH 11.7 with N NaOH, add 2% Rose bengal s o l u t i o n (1 n i ~ )and chloroform (3.5 d).AUOW t o stand for several hours, shaking 5 o r 6 times during t h i s period. Measure t h e c o l o r i n t h e chloroform l a y e r a t 550 nm. A blank i s necessary. Drey (129) has described spectrophotometric assay of quinine, 2 H C 1 i n t a b l e t s .
-
Malat (130) has reported an e x t r a c t i o n spectrophotometric determination of organic bases, including quinine, with some metallochromic i n d i c a t o r s . The procedure involves t h e addition of t h e i n d i c a t o r t o a s o l u t i o n of quinine,H$O4, a d j u s t i n g t h e pH a t 1 . 4 t o 6.8 and e x t r a c t i o n with chloroform. The absorption spectrum i s then recorded from 400 t o 700 nm. Eriochrome red B i s t h e most s u i t a b l e f o r determination of quini n e ; t h e absorbance being measured a t 475nm.
QUININE HYDROCHLORIDE
607
Schmitz and Menges (131) have a l s o reported a colorimetric determination of quinine i n t i n c t u r e s with Tropaeolin 00. I n t h i s method, about 0.5 gm of t i n c t u r e of cinchona, i s d i l u t e d t o 250 m l with water, and a 5-ml portion i s mixed with 1 0 ml of an a c e t a t e b u f f e r s o l u t i o n of pH 4.6 and 3 m l of a saturated aqueous Tropaeolin 00 s o l u t i o n . The well-shaken mixture i s then e x t r a c t e d with chloroform and t h e combined e x t r a c t s are a c i d i f i e d with 3 ml of an a c i d reagent (1 ml of concentrated ~ 2 ~ and 0 4 99 ml of methanol), and made up t o 50 m l with chloroform. The e x t i n c t i o n i s then determined and quinine content i s estimated by comparison with standard curves. Blank determinat i o n i s necessary. Graham and Thomas (132) have described a q u a n t i t a t i v e determination of a l k a l o i d s , including quinine, using dichromate sulphuric a c i d . The s o l u t i o n containing t h e a l k a l o i d ( 0 . 1 - 4 P moles) i s mixed with 5% aqueous potassium dichromate s o l u t i o n (1 m l ) , heat a t 30° f o r 5 minutes , add concentrated ~ 2 S 0 4( 8 m l ) , mix, cool i n i c e f o r 20 minutes and measure t h e e x t i n c t i o n a t 650 nm. Subtract a reagent blank. The c h a r a c t e r i s t i c green c o l o r i s given by 25 a l k a l o i d s . Methanol, ethanol, u r e a , and many s a l t s i n t e r f e r e , but ethanol may be used a s a solvent i f an equal amount i s included i n the blank s o l u t i o n . 10.5.2
Ultraviolet Volkova and Getman (133) have described an extraction-photometric determination of quinine as t h e t e r n a r y complex with t i t a nium and s a l i c y l a t e . In t h i s method, t h e t e s t s o l u t i o n (10ml), containing 1ODg of quinine, i s mixed with 1 m l of 0.01 M Tic14 i n 0.8 N H C 1 , 1ml of 0.05 M sod. s a l i c y l a t e and 1 0 ml of CHC13. The pH of t h e s o l u t i o n i s adjusted t o 3 with 0.1 N NaOH and t h e yellow t e r n a r y complex i s completely e x t r a c t e d i n t o t h e C H C l 3 by vigorous shaking f o r 2 minutes. The e x t r a c t is f i l t e r e d , and t h e e x t i n c t i o n
-
FARID J . MUHTADI ETAL.
608
of t h e f i l t r a t e i s measured a t 380 o r 400nm. Chloride , s u l p h a t e , n i t r a t e , and a c e t a t e do n o t i n t e r f e r e . A t low c o n c e n t r a t i o n o f q u i n i n e , metal i o n s do n o t i n t e r f e r e ; i r o n can b e masked w i t h a s c o r b i c a c i d o r sodium t h i o s u l p h a te
.
Prudhomme (134) has r e p o r t e d a c o l o r i m e t r i c a s s a y of q u i n i n e i n b i o l o g i c a l f l u i d s and i n organs. I n t h i s method, q u i n i n e i s determined by adding 2% e o s i n t o t h e l i q u i d , b u f f e r e d t o pH 7 , and e x t r a c t i n g t h e r e d product w i t h chloroform and comparing the solution colorimetrically with standard s e r i e s . Liquids c o n t a i n i n g l e s s t h a n 0.01 mg of q u i n i n e are e x t r a c t e d f o r 24 hours. Urine i s f i r s t t r e a t e d w i t h l e a d a c e t a t e and H2SO4, and blood w i t h potassium o x a l a t e followed by s a t u r a t e d sodium s u l p h a t e and N H2SO4 a t 45-50'. Compounds of e o s i n w i t h q u i n i n e can b e d i f f e r e n t i a t e d by UV absorpt i o n s p e c t r a . The r a t e o f e l i m i n a t i o n o f q u i n i n e i n u r i n e , and i t s d i s t r i b u t i o n among organs have been s t u d i e d . P r o e t a l . (135) have r e p o r t e d s p e c t r o photometric d e t e r m i n a t i o n of q u i n i n e and h e r o i n (diamorphine ) I n t h i s method , equimolar c o n c e n t r a t i o n of t h e two a l k a l o i d s have almost t h e same a b s o r p t i o n a t 297.5 nm; w h i l s t a t 330 nm t h e a b s o r p t i o n i s due e n t i r e l y t o quinine. A 100 mg of t h e mixed a l k a l o i d s w i t h 10 m l of anhydrous methanol i s f i l t e r e d through a s b e s t o s , t h e f i l t r a t e and methanol washings b e i n g d i l u t e d w i t h 0 . 1 N NaOH, and of t h i s s o l u t i o n 10 m l are a g a i n d i l u t e d w i t h NaOH - methanol s o l u t i o n . The e x t i n c t i o n i s measured a t 297.5 and 330 nm. The s t a n d a r d d e v i a t i o n f o r b o t h c o n s t i t u e n t s i s 4 1 . 5 p.p.m. on m i x t u r e s c o n t a i n i n g 30 t o 90 p.p.m., and 6 t o 30 p.p.m of q u i n i n e and diamorphine, r e s p e c t i v e l y .
.
Hadorn and Z u r c h e r ( 1 3 6 ) have p u b l i s h e d t h e a n a l y s i s and composition of beverages c o n t a i n i n g q u i n i n e and i t s decomposition p r o d u c t s . I n t h i s method, 6 samples were
QUININE HYDROCHLORIDE
609
found t o contain ( p e r l i t r e ) 25-57 mg of quinine t o g e t h e r with o t h e r c o n s t i t u e n t s . The quinine e x t r a c t e d from t h e beverages with e t h y l e t h e r w a s pure, but t h e quinine e x t r a c t e d with chloroform or carbon t e t r a c h l o r i d e contained decomposition products t h a t could be d e t e c t e d by TLC; t h e s e d i d not i n t e r f e r e with t h e spectrophotometric determination of quinine i n d i l u t e H2SO4 medium a t 346 nm. The s p e c t r a of quinine i n e t h a n o l , chloroform, and carbon t e t r a c h l o r i d e d i f f e r e d only s l i g h t l y from one a n o t h e r , but widely from t h e spectrum of quinine i n d i l u t e H2SO4. Kamath e t a l . (137) have s t u d i e d t h e W absorption of cinchona a l k a l o i d s , i n c l u d i n g q u i n i n e , i n 11 a l i p h a t i c a l c o h o l s . Quinine can be determined i n t h e presence of o t h e r 14% i n a l i p h a t i c alkaloids t o within a l c o h o l medium. Schmitt (138) has described t h e q u a n t i t a t i v e and q u a l i t a t i v e determination of W-absorbi n g compounds i n substances t o o dark or t o o t u r b i d f o r d i r e c t a n a l y s i s . The f i r s t or second d e r i v a t i v e s of t h e W s p e c t r a a r e used. They show much more d e t a i l than t h e d i r e c t s p e c t r a . The determination of quinine i n a t u r b i d beverage by t h i s technique has been r e p o r t e d A q u a n t i t a t i v e spectrophotometric determinat i o n of quinine and o t h e r cinchona a l k a l o i d s has been a l s o described
10.5.3 Atomic Absorption Spectrometry Recently , Minami e t a l . (140) have developed a q u a n t i t a t i v e a n a l y s i s of a l k a l o i d s , includi n g q u i n i n e , by t h e atomic absorption s p e c t rometry. I n t h i s method, 1 ml of a s o l u t i o n of Reinecke s a l t ( 6 mg/l m l ) and 5-10 m l of nitrobenzene a r e added t o 5-20 m l s o l u t i o n of t h e a l k a l o i d ( c o n t a i n i n g 1.5-100 11 g/ml) i n 0 . 1 M HC1. The mixture i s shaken and t h e nitrobenzene l a y e r i s removed, d r i e d , and C r i s determined t h e r e i n by conventional flame a.a.s. at 357.87 nm. By t h i s
FARID J. MUHTADI ETAL.
610
procedure, quinine, and several other alkaloids, can be indirectly determined with good precision. There is no interference from up to 37-fold molar amounts of 15 common inorganic ions.
10.5.4 Spectrofluorimetric Ragazzi and Veronese (141) have published a fluorimetric determination of quinine and some other alkaloids, after separation by TLC on magnesium oxide. Quinine is separated from natural materials or from mixed pharmaceutical preparations on a layer prepared from a suspension of hydrated magnesium oxide in 2.5% aqueous CaC12, using ethyl acetate - acetone (4:l) as the developing solvent. After locating the spots of quinine under W light, they are removed from the plate and dissolved in acid and the solution is used for the fluorimetric determination. Quinine emits fluorescence at 450 nm when excited at 350 nm. Brzezinska and Dzeidzianowicz (142) have reported a fluorimetric assay of quinine in the presence of aspirin and phenacetin. Quinine is extracted from the mixture by a known volume of 0.1 N H2SO4 and the intensity of fluorescence of quinine sulphate extract is then measured and referred to a calibration graph. Beer's law is obeyed for 1 to 50 p.p.m. of quinine in the extract. Schmollack and Wenzel (143) have described a fluorimetric determination of quinine in the nanogram range with use of a chamber paper-analysis (KAPA) apparatus. Fluorimetric measurements of quinine sulphate solution is carried out at 366 nm, showing a rectilinear calibration between 5 and 50 pg/ml. For 48 measurements at 30 l.lg/ml, the coefficient of variation is 7.69%. Other fluorescence analysis of quinine as well as various natural and synthetic drugs has been reported (144). Fluorescence spectra have been determined in ethanol, concentrated HC1, 10% NaOH, and
QUININE HYDROCHLORIDE
611
aqueous solutions at 0.01-0.001 mg/d The following identification test has been described (146). Dissolve 1 gm in 50 m l of water; the solution is not fluorescent. Dilute with lOOml of water and add M H2S04, an intense blue fluorescence is produced.
( 145).
McCloskey et al. (147) have developed a spectrofluorimetric determination of quinine in the blood and urine, following the consumption of tonic preparations.
10.5.5
Phosphorimetric Harbaugh et al. (148)have reported pulsedsource time-resolved phosphorimetric method for the quantitative determination of quinine and other drugs. The phosphorescence emission spectra, life times, and relative signals (peak emissions) have been determined with the use of the apparatus and procedures previously describe& by Fischer and Winefordner Time-resolved phosphorimetry provides a useful means for identifying quinine and other drugs even in some of their mixtures. For a multi-component mixture, the parameters cited indicate which of the drugs can be separated spectrally or temporarily or by P conobination of the two techniques.
Acknowledgement The authors wish to thank M r . Uday C. Sharma of the Pharmacognosy Dept., College of Pharmacy, King Saud University, Riyadh, for his secretarial assistance in the reproduction of the manuscripts.
FARID J. MUHTADI ETAL.
612
11.References
41,62
(1908).
1.
P. Rabe, Ber.,
2.
a,860,
3.
P. Rabe and K. Kindler, B e r .
4.
M. Uskokovic, J. Gutzwiller and T. Henderson, J. h e r . Chem. SOC., 92, 203, (1970).
5. 6.
7.
R.B. Woodward and W.E. Doering, J . h e r . Chem. SOC., (1945); m i d , 66, 849, (1944).
, 2, 466, (1918).
M. Gates, B. Sugavanam and W.L. S c h r e i b e r , I b i d ,
92,
E.C.
205,
(1970).
Taylor and S.F. Martin, I b i d ,
94,6218,
(1972).
G.Grethe, H.L. Lee, T. Mitt and M.R. Uskokovic, Helv. Chim. Acta, 56, 1485, (1973); J. Gutzwiller and M.R. Uskokovic, I b i d , 56, 1494 (1973).
8.
J . C . G r a s s e l l i and W.M. Ritchey "Atlas of S p e c t r a l Data and Physical Constants f o r Organic Compounds" 2nd ed. Vol. I V Y CRC Press I n c . , Cleveland, Ohio, (1975 )
9.
I . L . Finar "Organic Chemistry Vol. 2 , Stereochemistry and t h e Chemistry of Natural Products, 5 t h ed. , Longman, London a975 1.
10.
R.B. Turner and R.B. Woodward, "The Chemistry of t h e Cinchona Alkaloids" , i n "The Alkaloids", R.H.F. Manske and H.L. Holmes Eds. , Vol. 3, p. 1-63, Academic P r e s s , New York (1953).
11.
V. Prelog and E. ZalAn, Helv. Chim. Acta,
3, 535
(1944 1.
lla. G.G.
Lyle and L.K.
Keefer, Tetrahedron, 23,
3253 (1967). 12.
"Specifications f o r t h e Q u a l i t y Control of Pharmaceutical Preparations" 2ncJ ed. World Health Organization , Geneva , (1967).
13.
"The Pharmaceutical Codex" 11th ed. p. 774. The Pharmaceutical Press , L o n z n , (1979).
QUININE HYDROCHLORIDE
14.
"The British Pharrnacopeia" Her Majesty Stationery Office, Cambridge (1980).
15*
J.S. Glasby "Encyclopedia of the Alkaloids" Vol. 2, p. 1153, Plenum Press, New York (1975).
16.
E.G.C. Clarke "Isolation and Identification of Drugs" Vol. 1, p. 533, "The Pharmaceutical Press" London
613
(1978) .
17 *
L.V. Adeishvili, V.S. Bostoganashvili and R.M. Dinyazhko, Chem. abstr. 74, 6352 (1971).
18.
J. Kracmar and J. Kracmarova, Pharmazie, 29, 510, (1974).
19
A.L. Hayden and O.R. Samul, J. h e r . Pharm. Assoc. Sci. Ed., Q, 489, (1960).
20.
C.J. Pouchert and J.R. Campbell "The Aldrich Library of NMR Spectra", Vol. 9, 106 B, Aldrich Chemical Coy Wisconsin (1974).
21.
L.F. Johnson and W. C. Jankowski , "Carbon-13 NMR Spectra" A Wieley-Interscience Publication, 486, New York, (1972).
22.
W.O. Crain Jr., W.C. Wildman and J.D. Roberts J. Am. Chem. SOC., 93,990, (1971).
23.
E. Stenhagen, S. Abrahamsson and F. McLafferty "Registry of Mass Spectral Data" Vol. 3, p. 2023, A Wiley Interscience publication, New York, (1974).
24.
"The Merck Index" 9 G ed. Merck and Co. Inc. , Rahway , N. J. , U.S .A. (1976).
25.
Pelletier and E. Caventou, Ann. Chim. Phys., [2], (1820).
15, 291, 337
26.
M.S. Karawya "The Alkaloids" p. 116 Faculty of Pharmacy, Cairo University (1971).
27.
R. Rabe, W. Hutenburg, A. Schultze and G. Volger, Ber., 64, 2487, (1931).
28.
R. Goutarel, M.M. Janot , V. Prelog and W.I. Taylor Helv. Chim. Acta, 33, 150, (1950).
614
FARID J. MUHTADI ETAL.
29
N. Kowanko and E. Leete J. Am. Chem. SOC., 84, 4919 (19621.
30.
A.R. Battersby, R.T. Brown, R.S. Kapil, J.A. Knight, J.A. Martin and A.O. Plunkett , Chem. Comm., 888,(1966).
31.
E. Leete and J.N. Wemple J. Am. Chem. SOC. , 88,
32.
E. Leete and J.N. Wemple J. Am. Chem. SOC., 91,
33.
A.R. Battersby and E.S. Hall, Chem. Comm., 194 (1970).
34.
A.R. Battersby and R.J. Parry, Chem. Comm.,
35
I.M. Rollo in "Goodman and Gilman's The Pharmacological Basis of Therapeutics'' 6% ed., A.G. Gilman, L.S. Goodman and A. Gilman Eds., p. 1056, Macmillan Publishing CO., Inc., New York, (1980).
9
36. 37
4743 (1966).
2698, (1969).
(1971).
30,
31
M.H. Brooks, J.P. Malloy, P.J. Bartelloni, T.W. Sheehy, and K.G. Barry, Clin. Pharmacol Ther., l0, 85, (1969). B.B. Brodie, J.E. Bear and L.C. Craig J. Biol. Chem.,
188, 567, (1951).
38.
S.E. Barrow, A.A. Taylor, E.C. Horning and M.G. 219, (1980). Horning, J. Chrom. ,
39
G.M. Trenholme, R.L. Williams, R.E. Desjardins, H. Frischer, P.E. Carson and K.H. Rieckmann Clin. Pharmacol. Ther., 9, 459, (1976).
40.
"European Pharmacopeia",Vol. 1,hisonneuve S.A., Sainte-Ruffine, France, p. 272 (1969).
41.
"Remington's Pharmaceutical Sciences", 15th ed., Mack Publishing Co., Easton, Pennsylvania, P. 434 (1975).
42. 43.
a,
L.F. Yakovleva and G.I. Savel'eva, Chem. Abstr.
74, 6355 (1971).
E. Sigel, Tribuna Farm. , l6, 1 (1948).
QUININE HYDROCHLORIDE
615
44.
H.A. Dingjan, S.M. Dreyer-Van Der Glass, and G.T. Tjan, Pharm. Weekbl. 115,445 (1980); Chem. Abstr. 93, 245534 (1980).
45.
H. Wachsmuth, Chim. Anal. Abstr. 42, 1526 (1948).
46.
W.
47
J.F.
(1947); Chem.
Poethke and R. Wigert, Anal. Abstr.
9, 2888 (1962).
Saredo, Anales Asoc. Quim. Farm. Uruguay
3 (1947); Chem. Abstr. 42, 6984 (1948).
48. 49
a,276
9
M. Ono, B.F.
21,
Ehgelke, and C. Fulton, Bull. Narcot.
31 (1969); Anal. Abstr.
2,454
(1970).
M. Hafez, Personal Communication, December 1982. S. B e r l i n and R.J.
50
&,
24,
Robinson, Anal. Chim. Acta,
319 (1961).
101,1259
(1961);
51
W. Schneider, Dtsch. Apothztg. Anal. Abstr. 2, 2479 (1962).
52.
J. J e r z y , Farmacja Pol. Abstr. 3, 931 (1974).
53.
P. Kerny, J.P. B i l l o n , and F. Bigeard, Ann. Pharm. Franc., 901 (1960); Anal. Abstr. 8, 4814 (1961).
54. 55.
a,1107
(1973); Anal.
18,
I. Simonyi and G. Tokar, Acta. Chim. Acad. S c i . Hung., (1960); Anal. Abstr. 8, 2602 (1961).
2,305
M. Hidicke and K. Howorka, Pharm. Zentralh,
99,
312 (1960). M. Rink, R. Lux, and M. Reimhofer, Dtsch. Apothztg., 1231 (1960); Anal. Abstr. g, 1702 (1961).
56
100,
57
L. Nyitray, Acta Pharm. Hung., 32, 27 (1962).
58
S.A. Soliman, H. Abdine, and N.A. S c i . , 63, 1767 (1974).
Zakhari, J. Pharm.
P. Ekeblad, J. Pharm. Pharmacol.,
k,
59
9
60.
636 (1952).
B. Waligora and M. Paluch, Chem. Anal., Warsaw, 239 (1964); Anal. Abstr., l2, 4153 (1965).
2,
616
FARID J. MUHTADI ETAL.
22,
61.
Z. S t r a n s k y and V. Stuzka, Chemicke' Zvesti, 424 (1968); Anal. A b s t r . , lJ, 2541 (1969).
62.
A . I . Matiu, C. Popescu, and A. Ghiorghiu, P r o d u i t s Pharm., 2, 295 (1948); Chem. Abstr. 42, 7934 (1948).
63.
64.
P. Majlat and I. Bayer, Acta Pharm. Hung., 33,
77 (1963).
A. Zaitsev, Aptechnoe Delo,
12,
6,
48 (1957); Anal. A b s t r . ,
1668 (1958).
S. R o l s k i , M. Gajewska, and E. Matusak, Farm. P o l . , 111 (1969) ; Chem. Abstr. , 71, 33450 (1969)
65
25,
66.
B. Budesinsky and E. Vanickova, Cekosl. Farm., 77 (1958); Anal. Abstr. , 5, 225 (1958).
67
C.V. Yeh and F.H. Tsang, Yao Hsueh Pao, l0, 1 0 (1963); Chem. Abstr. , 2, 13768 (1963).
68.
G. Bionda, E. Bruno, and A. Bellomo, Farmaco, Ed. Prat. 530 (1963); Anal. A b s t r . , 1 2 3 1 (1965).
69
G. Lemahieu, C. Lemahieu, B. R e s i b o i s , and J. B e r t r a n d , Annls Pharm. F r . , 32, 513 (1974); Anal. Abstr., 3,
18,
2,
12,
567 (1975). 70
A.I.
Gengrinovich, L.E.
Abstr.,
71
Korneva, and A.M. Murtazaev, , 2, 355 (1960); Anal.
Trudy Tashkent. Farm. I n s t . R.L.
g,
4456 (1961).
Charles and A.M.
Knevel: J. Pharm. S c i . ,
2,
1678 (1965).
, &,
181
72
M. Souckova and J. Zyka, Ceckosl. Farmac. (1955); Anal. Abstr., 3, 498 (1956).
73
Ibid.
74
L. Molnar and K. Molnarova, Chem. Z v e s t i . , (1957); Anal. Abstr., > I 2363 (1958).
75
L. Molnar, Acta Chim. Acad. S c i . Hung., Anal. A b s t r . , 5, 1663 (1958).
76.
M. G i r a r d and F. Roussel.et, Ann. Pharm. Franc., 20, l o g (1962); Anal. Abstr. 2, 3872 (1962).
, 2,
227 (1955).
2,
11,259 273
(1956);
617
QUININE HYDROCHLORIDE
77
K.I. Bralinova, Farm. Zh., k , 70 (1980); Chem. Abstr. , 93,245555 (1980).
78
A. Suszko-Purzycka and W. Trzebny, Farm. Anal. Abstr. 3504 (1967).
79
R. Verpoorte, T. Mulder-Krieger, J.J. Troost, and A.B. Svendsen, J. Chromatogr., , + & I 79 (1980).
9
a,
k,
43 (1966);
80.
R. Verpoorte and A.B. Svendsen, ibid, 100,227 (1974).
81.
"The United States Pharmacopeia", XIX , Mack Publishing Co., Easton, Pa., p. 436 (1975).
82.
M.A. Johnston, W.J. Smith, J.M. Kennedy, A.R. Lea, and D.M. Hailey, J. Chromatogr., 189, 241 (1980).
83.
R.N.V.
84.
U.R. Cieri, J. Pharm. Sci. , 58, 1532 (1969).
85
M.H. Hashmi, S. Parveen, and N.A. Chughtai, Microchim. Acta, 2, 449 (1969); Anal. Abstr., 2,1660 (1970).
86.
N. Oswald and H. Fluck, Pharm. Acta Helv.,
87
V. Schwarz and M. Sarsunova, Pharmazie,
88.
I. Alwas, J. Derlikowski, A.B. Narbutt-Mering, E. Perkowski , and W. Weglowski, Anal. Abstr. , 9,2885
Rama and N.J. Singh, Curr. Sci.,
(19641
49,193
(1980).
3,293
re, 267 (1964).
(1962)
89
F. Wartmann-Hafner, Pharm. Acta Helv. , 41, 406 (1966).
90
M. Petkovic , Acta Pharm. Jugosl. , &, 23 (1974).
-
91
92
L.A. Dal Cortivo, C.H. Willumsen, S.B. Weinberg, and W. Matusiak, Anal. Chem., 3, 1218 (1961). V. Parrak, E. Radejova, and 0. Mohelska, Cslka Farm., Abstr. , 2,2556 (1970).
18, 309 (1969);Anal
93
H.J. Huizing, F. De Boer, and T.M. Malingre, 407 (1980). J. Chromatogr.,
94.
H.V. Street, Clin. Chim. Acta, Abstr., 2, 4343 (1962).
a,
1,226
(1962); Chem.
FARID J. MUHTADI ETAL..
618
95. H.V. Street and S.K. Niyogi, Nature, 190, 1199 (1961). 96. H. Steger and A. Storz, Pharmazie,,6.l
126 (1961).
97. I. Jakube', V. Laskova, and E. Slamova, Farmacia, 25, 137 (1956); Anal. Abstr., 5, 225 (1958). 98. J. Kolankiewicz and M. Nikonorow, Acta Polon. Pharm., 16, 115 (19591.99. J. Stork, J.P. Papin, and D. Plas Ann. F'harm. Fr., 17, 1 0 1 (1971). 100. R.A. Egli, Z. Anal. Chem. , 259, 277 (1972).
101. E. Smith, S. Barkan, B. ROSS, M. Maienthal, and J. Levine, J. Pharm. Sci. , 62, 1151 (1973). 102. J.M.G.J.
Frijns, Pharm. Weekbl.,
103,929 (1968).
103. D. Waldi, K. Schnackerz, and F. Munter, J. Chromatogr.,
6, 61 (1961).
104. K. Roder, E. Eich, and E. Mutschler, Pharm. Ztg., 115, 1430 (1970). 105.
R. Van Severen, J. Pharn. Belg.,
a,40 (1962).
106. I. Sunshine, W.W. Fike, and H. Landesman, J. Forensic Sci., 11,428 (1966). 107. A.C. Moffat, K.W.
Smalldon, and C. Brown, J. Chromatogr. , 90, 1 (1974).
108. Ibid, 90,9 (1974). 109. K.K. Kaista and J.H. Jaffe, J. Pharm. Sci., 6 l , 679 (1972). 110. F. Schmidt, Deut. Apoth. Ztg.,
114,1593 (1974).
111. J. Stork and J.P. Papin, B u l l . SOC. Chim. Fr., 105 (1973).
-
619
QUININE HYDROCHLORIDE
112. S. Thunell , J. Chromatogr.
113. R. Neu, J. Chromatogr.,
114. M.
, 130,209 (1977)
2,364 (1963).
Sarsunova and J. Hrivnak, Pharmazie,
2,608 (1974),
115. P. Suchocki, S. Tonska, J. J a r z e b i n s k i , and T. P i e c h o c k i , Acta Pol. Pharm. Anal. Abstr. , 38, 315 (1980).
, 36, 193 (1979);
116. B. Davidow, N.Li P e t r i , and B. Quame, Tech. Bull. R e g i s t . Med. Technol., 38, 298 (1968); Chem. A b s t r . ,
18, 2599 (1970).
117. K. Wahl and T. R e j e n t , J. Anal. Toxicol.,
118.
3, 216 (1979).
O.A. Akopyan, B . I . S h v y d i k i i , S . I . Baik, D.Y. Rogovskii, Z.S. Rokach, A . I . Shkadova, and O.M. Shcherbina, Farm. Zh., 49 (1979); Anal. A b s t r . , 3,667 (1980).
k,
119.
C.L.
Brown and P.L. K i r k , Mikrochim. Acta,
(1957).
5, 720
120. A.W.
Missen, Rep. N.Z., Dep. S c i . Ind. Res., Chem. Div., C.D. 2282, 36 (1979); Chem. Abstr., 92, 103928
(19801
121. M. Bonini, F. Mokofio, S. B a r a z i , J. Chromatogr.,
224, 332 (1981).
10,
122. N . J . Pound and R.W. 122 (1975).
S e a r s , Can. J. Pharm. S c i . ,
123. J.K.C.
Kennedy, Unpublished results.
124.
Low and J.M.
R. G i m e t and A. F i l l o u z , J. Chromatogr.,
333 (1979).
125. M. Bauer and G. Untz , J. Chromatogr.
, 192, 479 (1980).
126.
H . J . J e u r i n g , V.H. W i l l e m , V.D. P i e t e r , and T.B. 281 R e i n i e r , Z. Lebensm. - U n t e r s . Forsch. (1979); Anal. A b s t r . , 38, 570 (1980).
127,
R.G.
128.
M. Hasselmann, Compt. Rend., Abstr. , 5, 2316 (1958).
, 169,
Achari and J.T.
81 (1980).
J a c o b , J. Liq. Chromatogr.,
3,
244, 2860 (1957); Anal.
620
129.
FARID J . MUHTADI ETAL.
R.E.A.
Drey, J. Pharm. and Pharmacol.,
2, 739 (1957).
130. M. Malat, Anal. Chim. Acta, log, 191 (1979). 131.
B. Schmitz and W. Menges, Dtsch. Apothztg., 747 (1957); Anal. Abstr. , 2, 1332 (1958).
a,
132. H.D. Graham and L.B. Thomas, J. Pharm. Sci.,
(19611.
133.
2,901
A.I. Volkova and T.E. Get'man, UKr. Khim. Zh., 1320 (1965); Anal. Abstr., L4 2187 (1967).
2,
134. R.O. Prudhomme, J. Pharm. Chim. , 2, 8 (1940). 135. M.J. Pro, W.P. Butler, and A.P. Mathers, J. Ass. Off. Agri. Chem., 3, 849 (1955); Anal. Abstr., -3 , 1845 (1956). 136. H. Hadorn and K. Zurcher, Mitt. Lebensmitt. Hyg., Bern, 55, 194 (1964); Anal. Abstr. , l2, 4856 (1965)
.
137. B.R. Kamath, C.V. Bhat, and S.L. Bafna, Indian J. Chem. , 6 , 510 (1968); Anal. Abstr. , l8, 1204 (1970) 138. A. Schmitt , Chem. Abstr. , 92, 37108 (1980). 139. V.K. Vera and B. Zora, Acta Pharm. Jugosl., Id, 111 (1968); Anal. Abstr. , 2,4337 (1970).
140. Y. Minami, T. Mitsui, and Y. Fujimura, Bunseki Kagaku, 30, 811 (1981); Anal. Abstr., 43,70 (1982). 141. E. Ragazzi and G. Veronese, Mikrochim. ichnoanalyst. Acta, 5-6, 966 (1965); Anal. Abstr., l b ,2188 (1967).
-
142. D. Brzezinska and W. Dziedzianowicz, Farmacja Pol., 22 , 416 (1966);Anal. Abstr., 7092 (1967).
14,
143. W. Schmollack and U. Wenzel, Pharmazie, 29, 583 (1974).
144. K. Nikolic, D. Malesev, and K. Velasevic, Acta Pharm. Jugosl., l8, 209 (1968); Anal. Abstr.
a,4330 (1970).
145. R.N. Alekseichik, V.P. Korolyuk, E.A. Tukalo, and E.D. Safonova, Chem. Abstr., 92, 99616 (1980).
146. J.M. Meola and M. Vanko, Clin. Chem.,
20,
184 (1974).
621
QUININE HYDROCHLORIDE
147.
K.L. McCloskey, J . C . G a r r i o t t , and S.M. R o b e r t s , J. Anal. Toxicol., 2, 110 (1978).
148.
K.F. Harbaugh, C.M. 0' Donnell, and J . D . Analyt. Chem. , 4 6 , 1206 (1974).
149. L. F i s h e r and J . D . 5073 (1972).
Winefordner,
Winefordner, Anal. A b s t r . ,
23,
RUTIN Taha I . Khalifa, Farid J . Muhtadi, and Mahrnoud M.A. Hassan 1.
2.
3. 4. 5. 6. 7.
8.
Description 1.1 Nomenclature 1.2 Formulae 1.3 Molecular Weight 1.4 Elemental Composition 1.5 Appearance, Color, Taste, and Odour Physical Properties 2.1 Crystal Properties 2.2 Melting Point 2.3 Solubility 2.4 Optical Rotation 2.5 Spectral Properties Stability and Incompatibility Isolation 4.1 Industrialition Synthesisof Rutin Biosynthesis of Rutin Biological Properties 7.1 Phannacological Activity 7.2 MicrobiologicalActivity 7.3 Therapeutic Uses 7.4 Metabolism of Rutin Methods of Analysis 8.1 IdentificationTests 8.2 Quantitative Determination 8.3 UV Spectrophotometry 8.4 PMR Spectrometry 8.5 Fluorimetry 8.6 Polarography 8.7 Densitometry 8.8 Gravimetry 8.9 Other Analytical Uses 8.10 Chromatography References
ANALYTlCAL PROFILES OF DRUG SUBSTANCES VOLUME I2
623
624 624 625 626 626 626 626 626 626 626 621 627 639 639 639 642 65 1 65 1 65 1 654 656 656 658 658
660 664 664 666 666 667 668 668 668 675
Copyright by the American Pharmaceutical Associalion. ISBN 0-12-260812-7
TAHA I. KHALIFA ETAL.
624
1.
Description 1.1. Nomenclature
1.1.1.
Chemical Names 3-[[6-0-(6-Deoxy-L.mannopyranosyl) -~-D-glucopyranosyl]oxy]-2-(3,4-dihydroxyphenyl)-5,7-dihydroxy-4H-Ibenz op yran-4 -one.
5
/
, 4 , 5-7-pentahydroxy, Flavone, 3, 3(6(0(6-deoxy-L-mannopyranosyl)) $-D-glucopyranoside. 2-(3, 4-Dihydroxyphenyl)-3, 5 , 7 trihydroxy 4-ox0-4H-chromen-3-yl rutinoside. /
/
3, 3 , 4 , 5-7-pentahydroxyflavone3-rutinoside. Quercet in-3-rut i n o s i d e .
1.1.2.
Generic Names (1-8) Rutin; R u t i n o s i d e ; Rutoside; Vitamin P, Melin; Phytomelin, E l d r i n ; E l i x a t h i n ; Sophorin; G l o b u l a r i c i t r i n ; P a l i u r o s i d e ; O s y r i t r i n ; O s y r i t i n ; M y r t i c o l o r i n ; Violaq u e r c i t r i n ; B i r u t a n ; Rutabion; Rutozyd; Tanrutin.
1.1.3.
Pharmacopoeias Rutin i s o f f i c i a l i n t h e f o l l o w i n g pharmacopoeias (8) : Hungarian; Japanese; P o l i s h ; Roumanian; Russian and S w i s s .
1.1.4.
Pharmacopoeia1 P r e p a r a t i o n s Th& f o l l o w i n g p r e p a r a t i o n s are o f f i c i a l i n t h e r e s p e c t i v e pharmacopoeias ( 9 ) : (a)
R u t i n I n j e c t i o n (Japanese Pharmacop o e i a ) , A s t e r i l e aqueous s o l u t i o n of r u t i n . No s t r e n g t h s p e c i f i e d . I t should be p r o t e c t e d from l i g h t .
625
RUTIN
(b)
1.1.5.
1.2.
T a b u l e t t a e R u t i n i ( R u s s i a n and German pharmacopoeias), Each t a b l e t c o n t a i n s 20 mg (Russian) o r 50 mg (German) of r u t i n .
P r o p r i e t a r y N a m e s (8, 10).
B i r u t a n (E. Merck, Germany) ; R u t i n o n (Rheinpharma, Germany) ; R u t a c i d (CID, Egypt). I n j t e n s ( D a g r a , H o l l a n d , Rutaminal Schenely, USA). Formulae 1.2.1.
Empirical '27
1.2.2.
H30 '16
Structural
OH
R u t i n o s e is: 6-0-(6-Deoxy-'DC-L-mannopyranosy1)-D-glucose w i t h e m p i r i c a l f o r m u l a C12H22010 mol. wt.326.30 and s t r u c t u r a l f o r m u l a as f o l l o w s : H
H
OH
TAHA I. KHALIFA ETAL.
626
T h i s s t r u c t u r e w a s proposed by Zemplen and Gerecs (11) and confirmed by t h e t o t a l s y n t h e s i s of r u t i n achieved by Shakhova e t a 1 ( 1 2 ) .
1.3.
1.2.3.
Chemical A b s t r a c t R e g i s t r y Number[CAS No] ( 1 ) [153-18-41
1.2.4.
Wiswesser Line Notation
T 66 BO EVJ CR-CQ DQ & DO A GQ IQ Molecular Weight
610.51
1.4.
Elemental Composition C , 53.11%; H,4.95%; 0,41.93%
1.5.
Appearance, Color, T a s t e , and Odour P a l e yellow n e e d l e s from water which g r a d u a l l y darkens on exposure t o l i g h t , tasteless and odourless.
2.
Physical Properties 2.1.
Crystal Properties
2.1.1.
Water of C r y s t a l i z a t i o n The c r y s t a l s from water c o n t a i n 3 H20, and become anhydrous a t l l O O C and 10 mm Hg
.
2.2.
Melting P o i n t Anhydrous r u t i n browns a t 125OC, m e l t s a t 188.7'C, becomes p l a s t i c a t 195-197OC, and decomposes w i t h e f f e r v e s c e n c e a t 214-215OC ( 1 )
2.3.
Solubility One gram r u t i n d i s s o l v e s i n about 8 l i t e r s water, about 200 m l b o i l i n g water, and 7 m l b o i l i n g methanol. It i s s o l u b l e i n p y r i d i n e , formamide and a l k a l i n e s o l u t i o n s ; s l i g h t l y s o l u b l e i n a l cohol, a c e t s n e , e t h y l acetate; p r a c t i c a l l y insol u b l e i n chloroform, carbon b i s u l f i d e , e t h e r , benzene and petroleum s o l v e n t s ( 2 , 3 ) .
RUTIN
627
2.4.
Optical Rotation
[ d l i 3+
13.82'
(ethanol);
[dli3 -
d i n e ) ; Deca-methyl d e r i v a t i v e [=I1' D nol. 2.5.
39.43'
-
33'
(pyri(etha-
Spectral Properties 2.5.1.
U l t r a v i o l e t Spectrum The UV spectrum of a u t h e n t i c r u t i n i n 95% methanol was scanned u s i n g Pye Unicam SP 800; from 200-500 nm. 2-4 d r o p s of 2 M NaOH s o l u t i o n were added t o t h e c e l l s o l u t i o n and t h e spectrum w a s measured i n presence of a l k a l i . Other s p e c t r a l s h i f t s were recorded by scanning d i f f e r e n t 95% e t h a n o l s o l u t i o n s of r u t i n t o which w a s added s u c c e s s i v e l y powdered sodium a c e t a t e and b o r i c a c i d and by adding two d r o p s 5% a l c o h o l i c aluminium c h l o r i d e s o l u t i o n and t h e n dil.HCl(13-13. The W and V i s i b l e S p e c t r a l maxima and s h i f t s f o r r u t i n are shown i n Table I and F i g . 1.
Table I! W and V i s i b l e S p e c t r a l Maxima and S h i f t s f o r Rutin.
bH
0
628
Ethanol S o l u t i o n
Alone
* h)
S p e c t r a l Maxima (nm) Band I
Band I1
Rand 111
259
266,S, 299,s
363
327
415
Spectral effect
Structural diagnosis
1 2 nm hypsochromic
3
s h i f t (band 111)
52 nm bathochromic
-
OH substituted
/
4
- OH f r e e
Plus 2 drops 2 M NaOH s o l u t i o n
272
P l u s 2 d r o p s 5% A 1 C1 s o l u t i o n 3
275
303,s
433
7 0 nm bathochromic s h i f t (band 111)
5 - OH f r e e
P l u s powdered NaOAc
271
325
393
1 2 nm s h i f t (band I)
7 - OH f r e e
P l u s NaOAc and
262
298
387
2 0 nm bathochromic s h i f t (band 111)
H3B03
s h i f t (band 111)
S = Shouder
These f i n d i n g s are i n agreement w i t h t h e r e p o r t e d d a t a (14, 15 and 16).
/
3
/
,4
, di
OH f r e e
TAHA I. KHALIFA ETAL.
630
2.5.2.
I n t r a r e d Spectrum The I R spectrum of r u t i n as K B r been determined on a Perkin-Elmer I n f r a r e d Spectrophotometer (Fig. s t r u c t u r a l assignments have been t e d f o r t h e c h a r a c t e r i s t i c bands t e d i n Table 2.
Table 2.
d i s c has 580 B 2 ) . The correlaas lis-
I n f r a r e d band f r e q u e n c i e s of Rutin and i t s c o r r e l a t i o n t o s t r u c t u r a l assignment.
Frequency (Cm'l)
Assignment
3330
OH (bonded)
2920
CH s t r e t c h
1660 1620
c=o c=c
1600
Aromatic s t r u c t u r e
1510
C = C aromatic
1460 1360
c - 0 - c
1295
c-0-c c-0-c c-0-c
1200 1060 8 10
S u b s t i t u t e d aromatics
These f i n d i n g s are i n agreement w i t h r e p o r t e d d a t a (16). Other f i n g e r p r i n t bands c h a r a c t e r i s t i c t o r u t i n
are: 970, 880, 730 and 700. 2.5.3.
Nuclear Magnetic Resonance S p e c t r a 2.5.3.1.
Proton
Spectra
The p r o t o n NMR S p e c t r a of f l a von i d s have been e x t e n s i v e1y s t u d i e d (13). A t y p i c a l PMR s p e c t r a of r u t i n are shown i n Fig. 3 & 4. The sample w a s d i s s o l v e d i n DMSO-D6 and TFA r e s p e c t i v e l y , and run on a Varian T 60A, 60-MHz NMR Spectrometer. All chemical s h i f t s
632
TAHA I. KHALIFA ETAL.
fig. 3 NMR Spectrum o f R u t h in DMSO-D,
I
I
I
I
500
I
I
I
TO
I
I
6.0
54
I 1
I
I
I
4.0
PPM (6)
. I
3.0
1
I +
I
-
200
1
.
80
I I
300
400
100
I I
I
2.0
in
fig. 4 NMR Spectrum of Rutr'n in TFA.
1
01
RUTIN
633
reported a r e i n reference t o t e t r a m e t h y l s i l a n e (TMS) a t 0 ppm. The PMR s p e c t r a l a s s i g n ments of r u t i n are given i n T a b l e 3. Table 3.
Chemical S h i f t s of R u t i n i n DMSO-D6 and TFA
Group
Position
Chemical S h i f t s (6) DMSO-D5
TFA -
103(d)
1.45 (bS)
Rhamnoglucosyl
3.20;3.40 (bS)
3.90;4.20 (bS)
H-1 Rhamnosyl
4.40 ( S )
5.00 (S)
5.30 (bS)
5.00 (S)
CHM4
Rhamnosyl Me
H- 6
Aromatic
6.17 (SL)
6.72 ( S )
H-8
Aromatic
6.36 (SL)
6.83 (SC)
Aromatic
6.80 (d)
7.10 (d)
Aromatic
7.50 (bS)
7.85 (d)
H-2
Aromatic
7.50 (S)
8.00 (S)
(S) = S i n g l e t ;
(d) = d o u b l e t ;
/
H- 5 /
H- 6 /
(bS) = broad s i n g l e t ;
(SL) = S i n g l e t showing long range c o u p l i n g .
2.5.3.2.
Carbon-13 Magnetic Resonance Spectroscopy Proton-noise and o f f - r e s o n a n c e decoupled 13C-NMR s p e c t r a were measured on a V a r i a n FT-80 A80 MHz F o u r i e r t r a n s f o r m NMR Spectrometer o p e r a t i n g a t 23.5 m z . Samples were p r e p a r e d i n 1 0 mm 0.d. t u b e s i n approxtmately 10% s o l u t i o n i n D?'fSO-D6 w i t h tetramethylsilane a s i n t e r n a l r e f e r e n c e . S p e c t r a were r e c o r ded w i t h 8 K d a t a p o i n t s a t a probe t e m p e r a t u r e of 23OC. For an average s p e c t r a l width of
TAHA I. KHALIFA ETAL.
634
5000 Hz., a 1 0 ps p u l s e w i d t h corresponding t o a t i l t angle of 30° w a s employed w i t h 2 s i n t e r v a l between p u l s e s . 13CNMR c o m p l e t e l y decoupled and o f f - r e s o n a n c e of r u t i n a r e p r e s e n t e d i n F i g s . 5 and 6 and t h e carbon chemical s h i f t s a s s i g n e d on t h e b a s i s of t h e a d d i t i v e l y p r i n c i p a l s and t h e o f f r e s o nance s p l i t t i n g p a t t e r n are shown i n T a b l e 4 . R e c e n t l y 1 3 C NMR d a t a of f l a v o n o i d s w e r e r e p o r t e d ( 17-24) Chang ( 2 5 ) determined 1% NMR of t h e aglycone of r u t i n amongst o t h e r f a l v o n o i d s by t h e g a t e d decoupling t e c h n i q u e . The s p e c t r a l i n t e r p r e t a t ion s we re based on t h e i n f o r m a t i o n from 13C-lH c o u p l i n g p a t t e r n s .
.
OH
Rutinose
635
4600 H z
2doo
Fig. 5
13
C
NM R
OP Rutin, Noise Decoupled S p c t f U m .
4 1 i
I
3h
fig.6
N
C NMR OF Rutin, off Resonance Spectrum.
n n n n n n n
z z z w- z z z
. . . . . . .
m r l m o N r l e m b m * m o b m r l r l U ) m e o m N N r ( r ( O 0
cd
e U)
r l r l r l r l r l r l r l
W\U)\d\N\Ul
3 N O 3 A 1 3 V
n w
n
v
n
w
n
m m c n m
w
. . . . .
r l U ) U l m * U ) m U ) e e
03
cd N
\* \m
r l r l r l r l r l
Ul
3 N 0 3 1 1 3 V
rl
e m b
m e rl
0
rl
v)
a,
n
1
0 U M
rl W
u
I
U)
8 V
3ns
8 V 3 f l S
a
*d cd
I-r
U
G
aJ U
0
m
h
.d U
.d
a
a, 0 Ll (d
:
M
0
w
G
0 P Ll cd U .K
RUTIN
637
2.5.4.
Mass Spectrum The mass spectrum of r u t i n o b t a i n e d by d e s o r p t i o n chemical i o n i z a t i o n (DCI) u s i n g ammonia as a r e a c t a n t g a s shows a molecular ion a t m / e 611 amu. The prominent fragments and t h e i r r e l a t i v e i n t e n s i t i e s are shown i n Table 5 . OH
A
Table 5 .
Mass Spectrum of R u t i n
m/e
Relative i n t e n s i t y (2’)
303 611 628 164 180 3 04 308 320 32 6 449 465
100.00
28.88 2.22 57.77 66.66 44.44 22.22 24.44 42.22 11.11 33.33
B
C
Fragment
A + 2 H M+
M+
-
+ NH3
C A + 3 H
-
!
J
164
197 212
180
431
-
-
,430 ,4[0 449
,
I .
290
-
;I0
1
.
1
530
550
570
463472482
Fig. 7
590 611
Mass Spectrum
of
Rutin
628
.
RUTIN
3.
639
S t a b i l i t y and I n c o m p a t i b i l i t y Rutin is more s t a b l e than q u e r c e t i n i n t h e presence of low c o n c e n t r a t i o n s of a l k a l i . I n a c i d s o l u t i o n s , r u t i n is hydrolysed t o q u e r c e t i n which is r e l a t i v e l y s t a b l e under t h e s e c o n d i t i o n s ( 2 6 ) . It should be p r o t e c t e d from l i g h t . Rutin i s incompatible w i t h a c i d s and s a l t s of heavy metals ( 8 ) .
4.
Isolation R u t h i s undoubtedly t h e most widespread of a l l quercet i n g l y c o s i d e s and probably o c c u r s i n up t o 25% of any given l o c a l f l o r a ( 1 4 ) . It h a s been found t o occur i n many p l a n t s , e s p e c i a l l y t h e buckwheat p l a n t (Fagopyrum esculentum Moench., Polygonaceae) up t o about 3% (1) l e a v e s of tobacco ( N i c o t i a n a tabacum L . , Solanaceae) (1) Ruta g c a v e o l e n s Rutaceae, flower buds of Sophora japonica ; teguminosae up t o 18% (27) t h e s t a l k s of tomato,Solanum persicum s o l a n a c e a e , l e a v e s of Eucalyptus spp., f l o w e r s of c e r t a i n Mangolia ( 28 ) and many o t h e r p l a n t s . A g e n e r a l procedure f o r t h e i s o l a t i o n of r u t i n comprises drying of p l a n t material, followed by e x t r a c t i o n wtth a l c o h o l , t h e s o l u t i o n c o n c e n t r a t e d and t h e g l y c o s i d e is l e f t f o r c r y s t a l i z a t i o n (29). A d e t a i l e d procedure f o r i s o l a t i n g r u t i n from small quant i t i e s of p l a n t m a t e r i a l i s o u t l i n e d i n Fig. 8 ( 30 ) .
-
4.1.
Industrialization Due t o t h e h i g h p e r c e n t a g e s of r u t i n c o n t a i n e d i n t h e f a m i l y of Eucalyptus known as Myrtaceal [4?4% ( 2 7 ) ] ; thesc. s p e c i e s a r e processed now i n A u s t r a l i a f o r t h e commercial p r o d u c t i o n of r u t i n (27 6 31). Although many s o l v e n t s f o r t h e e x t r a c t i o n s t a g e have been i n v e s t i g a t e d i n c l u d i n g 95% e t h a n o l , and hot d i l u t e i s o p r o p y l a l c o h o l ( 3 2 ) , a s i n g l e - s t a g e b a t c h e x t r a c t i o n w i t h b o i l i n g water is recommended. (Fig. 9) r e p r e s e n t s a flowsheet diagram f o r t h e production of 50.000 l b l r u t i n p.a from Eucalyptus l e a v e s a c c o r d i n g t o Humphrey's method (31).
TAHA I. KHALIFA ETAL..
Ground p l a n t mate f i a l
I
I
Discard
4
Extract with boiling 80% Ethanol (2x200 m l )
Alcoholic Extract
Ether Extract
I
Aqueous Solution
S o l i d mate-
r,+ G , 1
I
Cry st a l l i n e Solid
Wash w i t h water,followed by e t h e r
iscard
Crude Rut i n P u r i f i c a t i o n on Magnesium s i l i c a t e column Pure Rut i n F i g~. . 8.
Procedure O u t l i n e f o r I s o l a t i o n of Rutin.
RUTIN
641
I
,
H a r v e s t e d Leaves of E u c a l y p t u s
1
Moi;;ye.
f
Comminution
aS30.7.5% R u t i n
C o n s t r u c t i o n Material (wood o r ceramic)
Crystalization temp. 4n0c
4 hours I R u t i n r e c o v e r y 95-97%
F i l t e r cake n r v i n p:
Crush i n g
I F i g . 9:
Packing
Rutin p u r i t y
P r o t e c t from l i g h t ,
Flow s h e e t f o r t h e commercial p r o d u c t i o n of R u t i n .
642
5.
TAHA I. KHALIFA ETAL..
Synthesis of Rutin The synthesis of rutin can be achieved according to the following three schemes. These schemes differ in the synthesis of ouercetin (the aglycone moiety of rutin). Scheme 1: Kostanecki -et al. 1904 (33 ) . Based upon the Claisen reaction between 2-hydroxy4, 6-dimethoxyacetophenone [l] and 3, 4-dimethoxybenzaldehyde [2] to give the intermediate [3] which upon treatment with HC1, cyclization occurs to give 5, 7, 3 , 4 ' -tetramethoxyflavonone [4]. Oximination affords [5] which upon treatment with F2SO4 enolisation occurs to give 5, 7, 1'34', -tetramethoxyflavonol [6]. Demethylation with HI affords quercetin [7].
,
Scheme 2: Robinson et al. 1926 (34 ) . Condensation ofw-methoxypholoroacetophenone [I] with veratric acid anhydride [2] in the presence of the potassium salt of veratric acid to give the diarylester [3]. On hydrolysis with alcoholic KOH affords 5, 7-dihydroxy-3,/3 ,4' -trimethoxyflavone [ 41 , which on demethylation with HI gives quercetin [5]. Scheme 3:
Shakhova et al. 1962 (35), complete synthesis of rutin.
W-methoxyphloroacetophenone [2] was condensed with 0-benzylvanillinic acid, anhydride [ 13 in triethylamine to give 5 , 7-dihydroxy-4 -benzyloxy-3, /3 -dimethoxyflavone [3]. On treatment with AcOH-HC1 mixture gave 5, 7,4' -trihydroxy-3,'3 -dimethoxyflavone [4]. Demethylation of the latter with HI yielded (about 802) quercetin [5]. Ouercetin potassium salt [6] was produced upon treating [5] with AcOK in ethanol. Levoglucosan [7] was acetylated with Ac20 in the presence of AcONa to give 2, 3, 4-triacetyllevoglucosan [8] which with TIC14 gave 1-chloro-2, 3, 4-triacetyl Dglucose [9]. L-rhamnose tetraacetate [lo] treated with TiBr4 in CHC13 gave 1-bromo-2, 3, I-triacetyl-L-rhamnose [ll]. [lo] + [11] heated with Hg (OAC)~in C6H6 gave (53x) CC acetochloro-f3-l-L-rhamnosido-6-D-glucose [12]. [12] was treated with AgOAc and acetylated with Ac20 to prodilce (68.703 B-heptaacetyl-f3-1-L-rhamnosido-6-D-glucose [13]. This with 33% HBr in AcOH gave (61%) d acetobromo-~-l-L-rhamnosido-6-D-glucose [14]. [14] and quercetin potassium salt [6] were dissolved in NH40H which was evaporated and treated with methanol and
-
RUTIN
Scheme 1 : Synthesis of Quercetin By Kostanecki e t al.
643
TAHAI. KHALIFA E T A .
644
H3C0
OCH3
0
I
HI
HO
Querc etin
RUTIN
645
Scheme 2 :
Synthesis of Quercetin By Robinson bt al. 0 0 II
I1
-c
c-0
1
1 COCH20CH3 OH
+
[11
ArCOO
0ch3
0
ArCOO
[31
KOH
EtOH
TAHAI. KHALIFA ETAL..
646
HO
OH
0
[41
HO OH
OH
0
[51
647
RUTIN
Scheme 3 : Synthesis of Rutin
-
OH
co
O t
OH O
O
H
COCH20CH3
FOCH2 OCH3
HO
OH
0
HO
I
[31
TAHA I. KHALIFA ETAL.
648
OH
[51
RUTIN
649
CH2 -0
OH
H
[71
-4
Tic14 CH20H
0
0
+
TiBr4
0
-
650
TAHA I. KHALIFA ETAL.
Ho(o$l
OH
OH
AgOAc Ace0
I
OH
0cch3 II 0
[i21
HO
0
651
RUTIN
p u r i f i e d o v e r a chromatographic column packed w i t h polycaprolactum r e s i n t o g i v e r u t i n [151. 6.
B i o s y n t h e s i s of R u t i n P o s t u l a t i o n of t h e b i o s y n t h e t i c pathway of f l a v o n o i d s s t a r t e d i n 1936 w i t h t h e s u g g e s t i o n o f Rohinson ( 3 6 ) t h a t t h e C15 s k e l e t o n of f l a v o n o i d s t o b e composed of two p a r t s c 6 and Cg as f o l l o w s :
'6
c-c I
cq ( cg+c3 )
B i r c h e t a l . (37 ) proposed t h a t r i n g A of t h e f l a v o noid s t r u c t u r e i s produced by t h e a c e t a t e pathway i . e . 3 a c e t a t e u n i t s condensed h e a d - t o - t a i l . Grisebach ( 38) f e d l 4 C H 3 COOH and CH314COOH and proved t h a t r i n g A i s b i o s y n t h e s i z e d from a c e t a t e . Neish and o t h e r s proved t h a t r i n g B i s formed from d i f f e r e n t r o u t e ( 3 9 ) i . e . cinnamic acid.The b i o s y n t h e s i s of r u t i n i s p r e s e n t e d i n Scheme 4 .
7.
Biological Properties
7.1.
Pharmacological A c t i v i t y R u t i n a s w e l l as i t s aglycone, q u e r c e t i n , have a d i r e c t c o n s t r u c t o r a c t i o n on t h e c a p i l l a r y bed and d e c r e a s e t h e p e r m e a b i l i t y and f r a g i l i t y of t h e v e s s e l s (40). It h a s been s u g g e s t e d t h a t t h e s e s u b s t a n c e s could b e c l a s s e d a s v i t a m i n s , p a r t i c u l a r l y of t h e "Vitamin P" t y p e . R u t i n h a s been found t o relax t h e i s o l a t e d i n t e s t i n e (41). Administered i n t r a v e n o u s l y t o t h e dog and r a b b i t , i n d o s e s of 5, 20 and 100 mg/kg r e s p e c t i v e l y , r u t i n i n v a r i a b l y produces a lowering of t h e blood pressure (42). Experimentally r u t i n p r o t e c t s a g a i n s t c a p i l l a r y i n j u r y (43-44) and d e c r e a s e s t h e erythematous r e s p o n s e t o l o c a l chloroform i r r i t a t i o n (43 & 4 4 ) . T h i s action may be due t o t h e a n t i a c i d a n t a c t i o n of r u t i n on adrenal i n e , thus r e s u l t i n g i n a s l i g h t increase i n its l e v e l and so i n c r e a s i n g t h e t o x i c i t y o f t h e p r e c a p i l l a r y s p h i n c t e r s and d e c r e a s i n g t h e t o t a l number of t r u e c a p i l l a r i e s f i t t e d w i t h f l o w i n g blood (43 & 4 4 ) . An i n t e r e s t i n g e x t e n s i o n
TAHA I. KHALIFA ETAL.
652
Scheme
4
: Biosynthesis of Rutin
Shikimic a c i d k -
Prephenic a c b id -.
653
RUTIN
OH
HO
OH
OH
0
Quercetin UDP-D-glucose
OH
Quercetin 3-glucoside
UDP-L-rhamnose
HO
Rutin
OH
OH
OH
TAHAI.KHALIFA ETAL.
654
of t h i s h a s been t h e r e s u l t s o b t a i n e d from t h e a d m i n i s t r a t i o n of r u t i n t o r a b b i t s s u f f e r i n g from s t a n d a r d i z e d experimental p r o s t h i h e . A dose of 50 t o 100 mp;/kg p e r day by stomach t u b e produces a marked acminution i n t h e loss of t i s s u e gangar e n e following p r o s t b i t e of r a b b i t f e e t , b u t is i n e f f e c t i v e i n p r e v e n t i n g loss of t i s s u e f o l l o wing p r o s t b i t e of r a b b i t ears (45) Quercetin is less e f f e c t i v e i n t h i s regard t h a n r u t i n ( 4 6 ) Rutin p r o t e c t s a g a i n s t h i s t a m i n e shock i n an ind i r e c t way h u t i s n o t a t r u e a n t i h i s t a m i n i c (47).
7.1.1.
LD 0 LD50 determined i n mice by i n t r a v e n o u s
-5
a d m i n i s t r a t i o n of propylene g l y c o l s o l u t i o n is 950 mg/kp hody weight (48). 7.2.
Microbiologlcal Activity Naghski, Copley and Couch(49-50) r e p o r t e d i n 1947 t h a t q u e r c e t i n , t h e aglycone of r u t i n , e x c r e t e d some i n h i b i t o r y e f f e c t on t h e growth of S t a o h y l o coccus aureus and o t h e r organisms, w h i l e r u t i n and q u e r c e t r i n w a a inacrive t5l), A recent a n t i m i c r o b i a l s c r e e n i n n of r u t i n and a u e r c e t i n was Derformed bv c u v - d a t e agar d i f f u s i o n method a g a i n a t Gram-positive, Gram-negative b a c t e r i a and y e a s t - l i k e fungus (52). The results of a c t i v i t v are p r e s c r i b e d i n Table 6 . The minimum i n h i b i t o r v c o n c e n t r a t i o n of r u t i n a g a i n s t Pseudomonas a e r u n i n o s a and P r o t e u s vulgaris were 10 mg and 10 mg/ml r e s p e c t i v e l y . Querc e t i n minimum i n h i b i t o r y c o n c e n t r a t i o n a g a i n s t
--
tively.
0
0
hl d
r-l
cr)
Kl
c
QI
0
l-i
0
0
0
c
*rl
U
PI
u
&
PI
7 0
656
TAHA I. KHALIFA ETAL..
7.3.
T h e r a p e u t i c Uses C o n s i d e r a b l e i n t e r e s t h a s been evinced i n t h e p o s s i b l e c l i n i c a l a p p l i c a t i o n of r u t i n t o t h e medical t r e a t m e n t of t h e s i c k (53 - 5 7 ) . R u t i n w a s f o r m e r l y used i n t r e a t m e n t of d i s e a s e s t a t e s c h a r a c t e r i s e d by c a p i l l a r y f r a g i l i t y , b u t evidence of i t s v a l u e i s i n c o n c l u s i v e . It h a s been claimed t o b e e s p e c i a l l y of v a l u e i n t r e a t ment of r e t i n a l haemorrhage. Though t h e r e i s no evidence t h a t c a p i l l a r y s t r e n g t h i s s p e c i f i c a l l y a s s o c i a t e d w i t h v i t a m i n C , some workers have claimed b e t t e r r e s u l t s from t h e u s e of r u t i n and a s c o r b i c a c i d s t h a n from r u t i n a l o n e ( 8 ) . R u t i n from tobacco l e a v e s w a s found e f f e c t i v e i n t r e a t i n g p a t i e n t s w i t h h y p e r t e n s i o n complicated by i n c r e a s e d c a p i l l a r y f r a g i l i t y ( 2 7 T 5 8 ) . R u t i n can i n h i b i t t h e a c t i o n of h y a l u r o n i d a s e , p a r t i c u l a r l y when combined w i t h a s c o r b i c a c i d . T h i s l e d t o t h e t e s t i n g of r u t i n w i t h a s c o r b i c a c i d as an o r a l c o n t r a c e p t i v e b u t i t s e f f i c a c y i n t h i s r e s p e c t h a s n o t y e t been confirmed. R u t i n h a s been used w i t h s u c c e s s i n t r e a t i n g some t y p e s of h e r e d i t a r y haemorrhagic d i s o r d e r s , s u c h as haemophilia, and a l s o b l e e d i n g gums, m i g r a i n e headaches, toxaemia i n pregnancy, e t c . ( 27 I n t h e US, r u t i n i s o f t e n i n c o r p o r a t e d i n v i t a m i n p r e p a r a t i o n s because of i t s e f f e c t i v e "vitamin P" f u n c t i o n ( 27 ) . Reports t h a t r u t i n a s w e l l as o t h e r "vitamin P" l i k e flavonoids decreased m o r t a l i t y o r hastened t h e r e c o v e r y of Roentgen-ray i r r i d i a t e d a n i m a l s were c i t e d (59,60). R u t i n and g e n e r a l l y b i f l a v o n o i d s s t i m u l a t e t h e p r o d u c t i o n of blood p l a t e l e t s , which a r e import a n t i n c o a g u l a t i o n , and a r e recommended i n t r e a t m e n t of thrombopenia ( 61
>.
>.
7.3.1.
T h e r a p e u t i c Dose (8) 50
7. 4 .
-
300 mg d a i l y .
Metabolism of R u t i n R u t i n and o t h e r f l a v o n o i d s are r e p o r t e d (62-67) t o be r a p i d l y absorbed f o l l o w i n g o r a l a d m i n i s t r a t i o n and c o n v e r t e d i n t o a v a r i e t y of hydroxy a r o m a t i c a c i d s which are r a p i d l y e l i m i n a t e d i n t h e u r i n e . The metabolism of r u t i n i s p r e s e n t e d i n Scheme 5.
657
RUTIN
Scheme 5 : Metabolism of Rutin
m-hydroxy phenyl acetic acid
3-rnethoxy, 4-hydroxyphenyl a c e t i c a c i d
658
8.
TAHA I. KHALIFA ET AL.
Methods of A n a l y s i s 8.1.
I d e n t i f i c a t i o n Tests
8.1.1.
Spot Appearance Daylight : grenish yellow : deep p u r p l e U V / N H ~ : yellow
w 8.1.2.
Chemical Tests a. b. c.
8.1.3.
D i l u t e s o l u t i o n of r u t i n g i v e s g r e e n c o l o u r w i t h f e r r i c c h l o r i d e T.S. ( 1 ) . R u t i n i s coloured brown by t o b a c c o enzyme under e x p e r i m e n t a l c o n d i t i o n s ( 2 ) . On a p p l i c a t i o n of t h e modified indophen o 1 method f o r t h e d e t e c t i o n of phenols ( 68 ) , r u t i n (> 10 pg) changes f i r s t t o b l u e then t o green. The c o l o u r f a d e s on t h e a d d i t i o n of 2 d r o p s 0.02% aqueous s o l u t i o n of N a C l O ( 6 9 ) . Among r e l a t e d compounds, h e s p e r i d i n ( > l o p g ) , h e s p e r t i n ( > 2 u g ) , and a c a c e t i n (> 5 pg) g i v e a similar c o l o r a t i o n which becomes more i n t e n s e on a d d i t i o n of NaOCI.
M i c r o c r y s t a l Tests R u t i n as w e l l a s i t s a g l y c o n e s q u e r c e t i n (0.2% m e t h a n o l i c s o l u t i o n ) gave c h a r a c t e r i s t i c golden c r y s t a l s ( F i g . l o ) , w i t h 2 , 4-dinitrophenylhydrazine H C 1 r e a g e n t ( l g i n 30 m l methanol 2 m l H2S04) ( 7 0 ) . T h i s t e s t could b e u t i l i z e d f o r t h e r a p i d d i f f e r e n t i a t i o n of r u t i n and q u e r c e t i n .
+
Fly, 10
Micfocf’sfals
of
Rutin
A 1 and Quercetin
(
0 ) with 2,4 Dinitrophenylhydraline
TAHA I. KHALIFA E T A .
8.2.
Q u a n t i t a t i v e Determination 8.2.1.
Colorimetry Use i s made of t h e c o l o u r e d d e r i v a t i v e s having h i g h molar a b s o r p t i v i t y i n UV and v i s i b l e r e g i o n , formed e i t h e r by c h e l a t i o n w i t h metals o r by r e a c t i o n w i t h s u b s t i t u t i o n reagents. 8.2.1.1. Che l a t ion
i.
With ALC13
A c c u r a t e l y weighed 5 g p l a n t sample& of t h e material were transferred into extraction t h i m b l e s and e x t r a c t e d w i t h abs o l u t e alcohol f o r 8 hours i n a Soxhlet a p p a r a t u s . The a l c o h o l e x t r a c t i o n w a s allowed t o c o o l to room t e m p e r a t u r e and made up t o 250 m l volume u s i n g a b s o l u t e a l cohol. A 25 m l p o r t i o n of t h i s s o l u t i o n w a s made up t o 100 m l volume w i t h isoamyl a l c o h o l and thoroughly mixed; a 20 m l a l i quot w a s t h e n t r a n s f e r r e d t o a s e p a r a t i n g f u n n e l and shaken w i t h f i v e s u c c e s s i v e p o r t i o n s of 25 m l of 0 . 1 M AlCl3 s o l u t i o n , a f t e r each s h a k i n g t h e s e t t l e d aqueous l a y e r b e i n g r u n o f f i n t o 1000 m l v o l u m e t r i c f l a s k and mixed t h o r o u g h l y , p l a c e d i n 1 cm c e l l and t h e a b s o r p t i o n a t 416nm n o t e d . The p e r c e n t a g e r u t i n w a s t h e n c a l c u l a t e d from a s t a n d a r d curve p r e p a r e d w i t h p u r e r u t i n (71). A s t h i s method does n o t measure t h e rutin-AlC13 complex alone but everything i n the s o l u t i o n d e r i v e d i n t h i s way which a b s o r b s a t 416nm, t h e p r e sence of o t h e r s u b s t a n c e s must be checked by chromatography and an examination of t h e a b s o r p t i o n curve i n t h e r a n g e 35Onm-5OOnm. Other flavonoid-AlC13 complexes u s u a l l y have a b s o r p t i o n m a x i m a
661
RUTIN
which d i f f e r from t h e r u t i n A l C 1 3 complex. An a l t e r n a t i v e p r o c e d u r e ( 72 ) f o r t h e d e t e r m i n a t i o n of r u t i n overcoming t h e f o r e mentioned d i s a d v a n t a g e s i s t o pap e r chromatograph t h e m e t h a n o l i c e x t r a c t of t h e p l a n t m a t e r i a l w i t h e t h y l acetate-anhydrous a c e t i c acid-water (50 :15 :18) a s developer. After drying t h e r u t i n s p o t was c u t o u t and ext r a c t e d w i t h nleefianol (2 m l ) , t h e n w i t h anhydrous a c e t i c a c i d (0.6 ml) and 20% aqueous p y r i d i n e (10 ml) and 12% m e t h a n o l i c A1C13 r e a g e n t (2.5 m l ) were added. The r e s u l t i n g s o l u t i o n was d i l u t e d t o 25 m l and t h e abs o r p t i o n was measured a t 42Onm (5-cm c e l l s ) a g a i n s t water. Beer's l a w was obeyed w i t h up t o 250 pg of r u t i n .
ii. With
Beryllium N i t r a t e
To a sample c o n t a i n i n g 0.1 + 1 . 2 u moles of r u t i n ( o r i t s aglycone q u e r c e t i n ) , an e q u a l amount of B e (NO3)2 d i s s o l v e d i n methanol was added, t h e n 2 N Na a c e t a t e s o l u t i o n (1.5 ml) w a s added, and t h e m i x t u r e was d i l u t e d t o 25 m l w i t h methanol. A f t e r 10 minutes t h e absorbance a t 465 nm was measured and t h e r e s u l t s were r e f e r r e d t o a s t a n d a r d curve ( 7 3 ) . R u t i n a s w e l l as i t s aglycone q u e r c e t i n , r e a c t w i t h Be2+ g i v i n g r e s p e c t i v e l y , yellow and orange I:1 complexes ( 7 3 ) . i i i . W i t h Quadrivalent Titanium Salts The c o n c e n t r a t i o n s of r u t i n an a l c o h o l i c e x t r a c t could be measured by t h e i n t e n s i t y of c o l o r of an orange yellow complex
TAHAI.KHALIFA ETAL.
662
formed w i t h Ti0 S04. The pH of r u t i n containing solution was a d j u s t e d t o 5.8 w i t h 3 N Na a c e t a t e . The c o l o u r , which i s s t a b l e f o r 30 minutes, w a s meas u r e d and t h e r e s u l t s were r e a d from a graph o b t a i n e d from r e a d i n g s of s t a n d a r d s o l u t i o n s ( 7 4 1. T h i s method e n a b l e s low c o n c e n t r a t i o n s (17 ppm) of r u t i n t o be determined i n pharmaceutic a l p r o d u c t s as well as i n p l a n t m a t e r i a l ( 7 4 1. iv. With Uranyl S a l t s The c o n c e n t r a t i o n of r u t i n i n a l c o h o l i c e x t r a c t s was d e t e r mined a b s o r p t i o m e t r i c a l l y by measuring t h e i n t e n s i t y of t h e colour of an orange complex formed by r u t i n and Uranyl acet a t e . The maximum a b s o r p t i o n was o b t a i n e d w i t h equimolar s o l u t i o n s i n a 1:l r a t i o (75 ) . Conc e n t r a t i o n s i n ppm range can be determined by t h i s method ( 75 ) . v.
With Cupric S a l t s
Rutin (10-M) was determined by t h e absorbance measurement of r u t i n CU (IT) complex i n s l i g h t l y a l k a l i n e methanol medium ( 76 & 77
1-
Other i n o r g a n i c i o n s produc i n g coloured complexes w i t h r u t i n e.g. Gallium (111) ( 78 and Antimony I11 ( 78 ) were a l s o used f o r i t s q u a n t i t a t i v e d e t e r m i n a t i o n In p l a n t material and pharmaceutical p r e p a r a t i o n s . 8 . 2 1.2.
Electrophilic Substitution i.
With p-aminobenzoic a c i d
A methanolic s o l u t i o n of r u t i n ( 4 ug) w a s a p p l i e d t o a Whatman No. 1 paper, and developed f o r 10 hours by t h e
663
RUTIN
a s c e n d i n g t e c h n i q u e w i t h n-butan o l - a c e t i c acid-water (20:5:11). The r u t i n zone w a s l o c a t e d on d r y chromatogram under UV o r by t r e a t m e n t w i t h ammonia fumes. The chromatogram w a s s e c t i o n e d and e l u t e d i n a t e s t t u b e by shaking w i t h 5 m l of acid-methano1 ( 1 : l ) . For t h e c o l o r i m e t r i c d e t e r m i n a t i o n 0.5% p-aminobenz o i c a c i d (0.4 m l ) , 10% H 2 S O 4 ( 0 . 4 m l ) , 0.2% NaN02 s o l u t i o n ( 2 ml) and 10% NaOH s o l u t i o n (5 ml) were added and t h e m i x t u r e w a s shaken. The a b s o r p t i o n a t 420 nm, was measured immediately ( 79 ) . T h i s method c o u l d be a p p l i e d t o o t h e r f l a v o n o i d compounds 6 i s claimed c o n v e n i e n t f o r samples w i t h a low r u t i n c o n t e n t
>.
( 79 ii. With E-aminocaproic a c i d
Rutin condensation product w i t h . Other e l e c t r o p h i l i c s u b s t i t u t i o n r e a g e n t s used f o r t h e e s t i m a t i o n of r u t i n and o t h e r flavonoids i n plant e x t r a c t s i n c l u d e d i a z o t i s e d amines, 4aminophenazone, 2 , 6 dibromoquinone c h l o r i m i d e , n i t r o u s a c i d ( 81 ) , and b o r i c a c i d i n d r y a c e t o n e ( 82 ) . Generally t h e s u b s t i t u t i o n methods s u f f e r from s e v e r a l d r a w backs. Not o n l y are t h e m a j o r i t y of t h e r e a g e n t s r a t h e r u n s t a b l e , b u t t h e r e a c t i o n s are c a r r i e d o u t i n a l k a l i n e s o l u t i o n , where many p h e n o l s are r a p i d l y o x i d i z e d . Furthermore, t h e p r e s e n c e of c a r b o n y l groups i n s e v e r a l f l a v o noids reduces t h e i r a c t i v i t y Again, t h e p r e s e n c e of c o l o r l e s s
.
TAHA I. KHALIFA ETAL.
664
8.3.
p h e n o l i c compounds makes i t a l most i m p o s s i b l e t o u s e such methods f o r t h e d e t e r m i n a t i o n of t h e f l a v o n o i d components i n crude plant extracts. W Spectrophotometry R u t i n h a s been determined i n pharmaceutical prepar a t i o n s by measuring i t s a b s o r p t i o n a t 256 nm a f t e r being e l u t e d w i t h a 1:l m i x t u r e of 0.1 N h y d r o c h l o r i c a c i d and methanol from s i l i c a g e l p l a t e s ( 83 ). R u t i n (Ca. 15 mg) i n compound p r e p a r a t i o n c o n t a i n i n g a e s c u l i n ( C a . 5 mg) i n a d d i t i o n was d e t e r mined by a p p l y i n g t h e drug sample t o t h e t o p of a column of 3 g of polyamide. Aesculin w a s e l u t e d w i t h water, then r u t i n w i t h methanol. The r u t i n c o n t e n t w a s determined s p e c t r o p b o t o m e t r i c a l l y a t 360 nm ( 8 4 ) . The recovery of r u t i n is s a i d t o be 95% ( 84 ) . The q u a n t i t y of r u t i n and o t h e r f l a v o n o i d of orange j u i c e of high pulp c o n t e n t determined by e x k r a c t i n g w i t h e t h y l a c e t a t e , and t h e f l a v o n o i d s of t h e e x t r a c t were s e p a r a t e d on a polyamide l a y e r w i t h ljenam~-dioxan-form~ca c i d ( 4 : 5 : 1) as developing s o l v e n t . The chromatogram was i r r i d i a t e d w i t h l i g h t of wavelength 254 nm where r u t i n zone was i d e n t i f i e d by i t s d a r k brown f l u o r e s c e n c e . R u t i n zone w a s e x t r a c t e d w i t h methanol and t h e abs o r p t i o n measured a t 358 nm ( 85 ) .
8.4.
PMR Spectrometry
A r a p i d and simple PMR procedure f o r t h e e s t i m a t i o n of r u t i n i n b u l k d r u g s and i n p h a r m a c e u t i c a l p r e p a r a t i o n s h a s been r e c e n t l y r e p o r t e d ( 86 1. The peaks a t 1.03 ppm and 7 . 5 0 ppm a s s i g n e d t o t h e t h r e e p o r t i o n s of rhamnose methyl group and t h e two 2 , 6 p r o t o n s of t h e a r o m a t i c r i n g of t h e aglycone moiety were chosen f o r t h e q u a n t i t a t i v e a n a l y s i s of r u t i n . Acetamide, e x h i b i t i n g t h r e e methyl p r o t o n s s i n g l e t a t 2 . 0 0 w a s used as an i n t e r n a l s t a n d a r d ( F i g . 1 1 ). DMSO-D6 h a s been used a s a s o l v e n t i n t h e a s s a y . The method proved t o be r e l i a b l e and a c c u r a t e bes i d e s i t a l s o f u r n i s h e s a s p e c i f i c means of ident i f i c a t i o n of r u t i n a s w e l l as simultaneous d e t e c t i o n of any h y d r o l y t i c p r o d u c t s of t h e assayed r u t i n v i z . q u e r c e t i n , rhamnose and g l u c o s e . T h i s f i n d i n g h a s c o n t r i b u t e d g r e a t l y t o t h e method.
TAHA I. KHALIFA ETAL.
666
8.5.
Fluorimetry A method based on measuring t h e i n t e n s i t y of r u t i n aglycone, q u e r c e t i n , as w e l l as o t h e r f l a v o n o i d s complexes w i t h A 1 d i r e c t l y on p a p e r chromatograms w a s d e s c r i b e d by Tyukavkina e t a 1 ( 87 ) . R u t i n and o t h e r f l a v o n o i d s were s e p a r a t e d by a s c e n d i n g chromatography on slow paper w i t h CHCl3-acetic a c i d (1:2) a s a s o l v e n t . The chromatogram w a s t r e a t e d w i t h 0.02 M A1C13 - 0 . 1 M Na acetate i n 50% e t h a n o l . Pieces of t h e chromatogram (3x4 cm) were a t t a c h e d t o t h e w a l l of a c e l l i n a f l u o r i meter, and t h e f l u o r e s c e n c e of t h e complexes were e x c i t e d w i t h a mercury lamp through a USF-3 f i l t e r a t an a n g l e of 45O ( 8 7 ) . The r e c t i l i n e a r p a r t o f t h e c a l i b r a t i o n graph l i e s i n t h e range of 1 . 6 3 iJg f o r q u e r c e t i n . The method w a s proved f o r various flavonoids i n prepared mixture with a d e t e c t i o n l i m i t of 0.05 I.rg and 0.8 I.rg f o r quercet i n and d i h y d r o q u e r c e t i n r e s p e c t i v e l y . Another f l u o r i m e t r i c - p l a n i m e t r i c method f o r t h e e s t i m a t i o n of r u t i n and f l a v o n o i d compounds w a s d e s c r i b e d by J e r z y e t a 1 ( 88 ) . The f l a v o n o i d compounds were s e p a r a t e d by two-dimensional p a p e r chromatography a s d e s c r i b e d by Glotzbach and Rimpler ( 89 ) and t h e n t h e c o n t e n t s of conpon e n t f l a v o n o i d s were determined by p l a n i m e t r y a f t e r d i r e c t measurement of t h e f l u o r e s c e n c e a t 365 nm ( 89 ) .
8.6.
Polarography
A method based on t h e d e t e r m i n a t i o n of n i t r o d e r i v a t i v e s of r u t i n (and q u e r c e t i n ) i n p h a r m a c e u t i c a l p r e p a r a t i o n s w a s d e s c r i b e d by Davidek and Manousek ( go ) The drug ( 0 . 1 g) w a s d i s s o l v e d i n met h a n o l (25 m l ) , and an a l i q u o t of t h i s s o l u t i o n (0.5 ml) w a s mixed w i t h methanol (0.5 m l ) , 0.2 N H2SO4 (5 ml) and 3 M KN02 (2 ml) i n a p o l a r o g r a p h i c v e s s e l . A f t e r bubbling t h e mixed s o l u t i o n w i t h n i t r o g e n f o r 2 . 5 minutes, 2.5 M N a a c e t a t e (2 ml) was added and t h e b u b b l i n g w a s c o n t i n u e d f o r a f u r t h e r 4 minutes. The p o l a r o g r a p h i c c u r v e w a s recorded and t h e f i r s t s t e p measured. The h e i g h t of t h e s t e p w a s e v a l u a t e d by means of a c a l i b r a t i o n curve o r by s t a n d a r d a d d i t i o n . It i s r e p o r t e d t h a t even 10-6M s o l u t i o n of r u t i n may b e analyzed; t h e h e i g h t of t h e waves are independent of t i m e and t h e e r r o r is f 4% ( g o ) . A s c o r b i c a c i d and o t h e r compounds l i k e l y t o be p r e s e n t i n p h a r m a c e u t i c a l s are s a i d t o have no i n t e r f e r e n c e ( 90 1.
.
667
RUTIN
Another p o l a r o g r a p h i c d e t e r m i n a t i o n of r u t i n and q u e r c e t i n i n c o n c e n t r a t i o n of Ca 1 0 - 6 ~a f t e r n i t r o s a t i o n by means of t h e f o u r - e l e c t r o n wave produced by t h e r e d u c t i o n of t h e n i t r o s o group w a s a l s o mentioned by t h e same a u t h o r s ( 91 ). 8.7.
Densitometry Cine e t a 1 ( 92 ) d e s c r i b e d a d e n s i t o m e t r i c method € o r t h e d e t e r m i n a t i o n of r u t i n and q u e r c e t i n i n m i x t u r e s . S e p a r a t i o n of r u t i n from q u e r c e t i n w a s done on s i l i c a g e l G p l a t e s u s i n g a 72:18:10 benzene-pyridine a c e t i c a c i d system. The two compounds were determined a t 370 nm and 400 nm respectively. The d e t e r m i n a t i o n e r r o r was 5%.
8.8.
Gravimetry The g r a v i m e t r i c methods by Rodwell ( 9 3 ) , Naghski ( 9 4 ) , based on Sando and B a r t l e t t ' s ( 95 ) method of i s o l a t i n g r u t i n were used i n t h e p r e l i minary work. An estimate of t h e v a r i a t i o n i n t h e r e s u l t s o b t a i n e d by t h e s e methods w a s made, t h e s t a n d a r d d e v i a t i o n b e i n g about 0.5% f o r r e s u l t s v a r y i n g from 5-20% r u t i n .
et a1
8.9.
Other A n a l y t i c a l Uses 8.9.1.
A s Chrcmogenic Reagent R u t i n and i t s aglycone, q u e r c e t i n , were found t o b e s e n s i t i v e r e a g e n t s € o r d e t e c t i n g i n o r g a n i c c a t i o n s on paper chromatog r a p h s ( 9 6 ) . The t e s t e d c a t i o n s i n c l u d e Ag, Hg, Cu, B i , Sb, Sn, Fe, A l , N i , Co, Mg, L i , Mo, Be, Ga, G e , I n , P r , N e , Sm, U, V , W, T i , L a , Th, Z r , and a r s e n a t e ( 96 & 97 1 From t h e a b s o r p t i o n c u r v e s i t w a s concluded t h a t e a c h atom of a b i , t e r and q u a d r i v a l e n t metal combines w i t h 2 , 3 and 4 m o l e c u l e s of r u t i n o r q u e r c e t i n r e s p e c t i v e l y ( 9 6 & 92).
8.9.2.
A s A n A n a l y t i c a l Reagent Oka and Matsuo ( 98 ) r e p o r t e d a s p e c t r o p h o t o m e t r i c method f o r t h e determin a t i o n of microgram q u a n t i t i e s of Germanium u s i n g q u e r c e t i n , t h e aglycone of
TAHAI. KHALIFA ETAL.
668
r u t i n . Q u e r c e t i n w a s allowed t o react with G e i n n e u t r a l s o l u t i o n (PH 6.4 - 7 . 1 , phosphate b u f f e r ) t o g i v e a y e l l o w i s h compl e x (A max 410 nm) which i s s o l u b l e i n water c o n t a i n i n g > 40 % methanol. The abs o r p t i o n spectrum of q u e r c e t i n i t s e l f h a s X max of 258 nm and 375 nm and h a s l i t t l e i n f l u e n c e on t h e l i g h t a b s o r p t i o n a t 410, 420, 430 and 440 nm f o l l o w s Beer's l a w f o r 0 . 5 pg of G e p e r m l i n t h e p r e s e n c e of an e x c e s s q u e r c e t i n (> 1 4 t i m e s t h e equiv a l e n c e of Ge) ( 98 ) . Other n e t h o d s were r e p o r t e d u s i n g r u t i n o r i t s aglycone q u e r c e t i n f o r t h e d e t e r m i n a t i o n of c a t i o n s e . g . Sn ( 99 ) , Z r ( gg 1, B ( gg 1, and V ( 100 ). 8.10. Chromatography 8.10.1.. Paper Chromatography 8.10.1.1.
One-Dimensional Descending PC The chromatographic d a t a of r u t i n u s i n g one-dimensional descending PC under d i f f e r e n t c o n d i t i o n s i s g i v e n i n Table 7
.
8.18.1.2.
Two-Dimensional Descending PC R u t i n i s r o u t i n e l y used as a s t a n d a r d marker i n s c r e e n i n g a l coholic plant e x t r a c t s f o r t h e i r flavonoid p a t t e r n s using t h e s o l v e n t s n-butanol-acetic acidwater (4: 1:5; t o p l a y e r ) BAW, and 5% a c e t i c a c i d ( 1 4 ) . R u t i n i s u s e f u l s i n c e i t occup i e s a p o s i t i o n approximately i n t h e middle of t h e chromatogram and a l s o i s , i t s e l f , v e r y common i n p l a n t s and t h u s one of t h e most l i k e l y compounds t o be found d u r i n g s u r v e y work.
Table 7.
Paper Chromatography of Rutin
Technique
One-dimensional descending PC
Paper
Whatman No. 2.
Solvent Detection
sl W;
45
hRf Reference
s2
s3
s4
s5
‘6
s7
51
23
Brownish Yellow Fluorescent s?ot I
46
15
a3
45
(101-1l92X( 101-102) (1031 (lo$) 0 0 3 )
S1
BAW (4:1:5, upper phase).
S2
Acetic acid-conc. HC1-water (30:3:10).
S3
Ethyl acetate-water (saturated).
S4
150-propanol-water (6: 4 )
S5
n-Heptane-n-Butanol-water (29:14:57).
s6
Acetic acid-water (15:85).
S7
Water.
.
(103) (102 )
TAHAI.KHALIFA ETAL.
670
8.10.1.3.
P r e p a r a t i v e PC P r e p a r a t i v e PC i s such a w e l l known t e h c n i q u e and i t s u s e i n t h e f l a v o n o i d f i e l d h a s been s o well-reviewed r e c e n t l y (13, 1 4 , & 104 ) t h a t a b a r e o u t l i n e of recommended t e c h n i q u e s should b e sufficient The u s u a l p a p e r used f o r l a r g e s c a l e s e p a r a t i o n (1-100 mg) i s Whatman No. 3 o r i t s e q u i v a l e n t . The s o l u t i o n t o b e s e p a r a t e d (Ca. 1 0 ml) i s a p p l i e d as a cont i n u o u s even narrow s t r e a k o r band a l o n g t h e s t a r t l i n e by succ e s s i v e a p p l i c a t i o n s . For r u t i n and t h e m a j o r i t y of f l a v o n o i d s s e p a r a t i o n i s f i r s t e f f e c t e d by t h e use of BAW m i x t u r e s ( e . g . 6:1:2). It i s convenient t o l o c a t e t h e s p o r t s by t h e i r f l u o r e s c e n c e i n W. A f t e r l o c a t i o n , t h e bands are c u t o u t , t h e compounds e l u t e d s e p a r a t e l y , u s u a l l y w i t h 70% aqueous methanol, and he s o l u t i o n s c o n c e n t r a t e d f o r r e p u r i f i c a t i o n i n a second s o l vent.
.
8.10.2.
L i q u i d Column Chromatography (LC) Tomas e t a1 ( 1 0 5 ) s e p a r a t e d r u t i n , querc e t i n and o t h e r f l a v o n o i d s on sephadex G25. Glyzosides were r e a d i l y e l u t e d w i t h water, w i t h good s e p a r a t i o n of r u t i n and q u e r c e t r i n : t h e accompanying aglycones w e r e r e t a i n e d a t t h e t o p of t h e column and could b e s u b s e q u e n t l y e l u t e d w i t h 0.1% aqueous ammonia s o l u t i o n . A 16~0.9cm column of Amberlite XAD-2 (200-400 mesh) maitltained a t 95OC w a s used f o r t h e s e p a r a t i o n of many f l a v o n o i d s ( 1 0 6 ) . The column w a s f i r s t e q u i l i b r a t e d w i t h 20% e t h a n o l a t a f l o w r a t e of 60 ml/hour and a s o l u t i o n o r s u s p e n s i o n of f l a v o n o i d s i n 20% e t h a n o l (each c o n t a i n i n g l e s s t h a n 500 pg/ml) w a s placed on t h e t o p of t h e column. A 100 m l volume of 20% e t h a n o l i s run f i r s t , followed by l i n e a r g r a d i e n t e l u t i o n w i t h a t o t a l volume of
RUTIN
671
1000 m l , t h e e t h a n o l c o n c e n t r a t i o n i n c r e a si-ng from 20 t o 9Oc. The r u t i n group f l a v o n o i d s w e r e e l u t e d from t h e column i n t h e o r d e r r u t i n , q u e r c i t r i n , and t h e n querc e t i n (106 ) . T h i s p r o c e d u r e w a s a l s o a p p l i e d t o t h e d e t e r m i n a t i o n of f l a v o n o i d s i n c r u d e m e t h a n o l i c e x t r a c t s from p l a n t s ( 106 ) The chromatographic behaviour of r u t i n u s i n g LC under d i f f e r e n t p a r a m e t e r s i s summarized i n T a b l e 8.
.
8.10.3.
Thin Layer Chromatography (TLC) Although a n a l y t i c a l TLC of r u t i n and o t h e r f l a v o n o i d compounds on m i c r o c r y s t a l l i n e c e l l u l o s e , s i l i c a g e l o r polyamide i s cons i d e r e d a r a p i d method of i n i t i a l s c r e e n i n g o r checking t h e p u r i t y of i s o l a t e d compounds ( 1 3 , 1 4 and 81 ) , t h e t e c h n i q u e is n o t f a v o u r i t e l y used f o r i n i t i a l examination of c r u d e p l a n t e x t r a c t s because t h e r e s o l v i n g power i s g e n e r a l l y i n s u f f i c i e n t . However, TLC is o f t e n t h e method of c h o i c e f o r f i n a l p u r i f i c a t i o n of r u t i n and o t h e r f l a v o n o i d s , e s p e c i a l l y using s i l i c a g e l s i n c e here contamination i s less t h a n on p a p e r ( 109 ) . The chromatographic d a t a of r u t i n u s i n g d i f f e r e n t TLC t e c h n i q u e s a r e d e p i c t e d i n T a b l e . 9. The chromatographic behaviour of f l a v o n o i d s on t h i n l a y e r s i s sometimes m i s l e a d i n g s i n c e some of them w i l l g i v e t h e same Rf v a l u e s even w i t h more t h a n one s o l v e n t system. T h i s l e d H u r s t and Harborne t o develop a method based on r e d u c t i v e c l e a v a g e of t h e s e compounds t o give rise t o phenols, phenolic alcohols and p h e n o l i c a c i d s which c o u l d b e more r e a d i l y i d e n t i f i e d (110). Q u e r c e t i n , t h e aglycone of r u t i n , g i v e s r i s e t o Dhloro$ u c i n o l (A-ring fragment) and 3,4-dihydroxyphenylpropionic a c i d and 3,4-dihydroxyphenylpropanol (B-ring f r a g m e n t s ) (110).
Table 8 .
Column Chromatography of Rutin
Packing
Sephadex G-25, medium particle size 35 cm long
Column Material Solvent Flow rate
H20 25mlllw1.r
I
X
2.5
0.05 M NaCl 25 ml/hour
grade
Sephadex LH-20
cm diameter
45 cmx2.5 cm
0.1 M NH40H
0.01 M Sod. Molybdate
Methanol
25 ml/hour
25 ml/hour
3-5 ml/min.
Temperature Detect ion
9 N
Kd
Kd
*
=
5.60
6.50
3.90
0.26
Ve/Vo*
(107)
(107)
(107)
(107)
( 108)
Dsstribution coefficient Under these conditions Ve/Vo
=
2.2 Kd
+
1; Ve = elution volume, Vo = intersitial volume.
4.00
$4
i
a, P
cu a u
a 1
(d $4
m
u v) ..L
(d
t
a c M
.d
c .r( a
!i
u
v)
(d
3 0 rl
a,
M
rl
0
(d
.d d
rl v)
I
a
(d
a
3 h
PI
0
rl
a
0
u LA
u c a c)
a
(I)
1
0
N F
rl
3
0
*a
rl rl
% $4
0
-2 a rl
673
n
rl 4 rl
W
a, CJ
!ll al
N
d
w
TAHA I. KHALIFA ETAL.
674
8.10.4.
Gas L i q u i d Chromatography (GLC)
The a g l y c o n e s of r u t i n and o t h e r f l a v o n o i d s could be s e p a r a t e d as t r i m e t h y l s i l y l (TMS) e t h e r s by GLC ( 1 1 2 ), b u t l i t t l e u s e h a s been made of t h i s t e c h n i q u e c o n s i d e r i n g i t s s e n s i t i v i t y ( t o t h e nanogram l e v e l ) , r a p i d i t y and t h e f a c t t h a t t h e compounds can be r e a d i l y e s t i m a t e d q u a n t i t a t i v e l y (113). I n almost r e p o r t e d c a s e s f l a v o n o i d e t h e r s have been s e p a r a t e d on columns cont a i n i n g t h e s i l i c o n e t h e r polar phases e . g . OV 1, OV 1 7 o r SE 30 ( 1 1 2 ) . 8.10.5.
Electrophoresis E l e c t r o p h o r e s i s on e i t h e r paper o r t h i n l a y e r s i,s a r e p o r t e d t e h c n i q u e (:114) which h a s been s c a r c e l y used i n t h e f l a v o n o i d f i e l d . R u t i n , and q u e r c e t i n amongst o t h e r f l a v o n o i d g l y c o s i d e s and a g l y c o n e s could be r e a d i l y s e p a r a t e d u s i n g b o r a t e b u f f e r s on TLC c e l l u l o s e l a y e r s ( 114 ) . However, e l e c t r o p h i l i c examination of e x t r a c t s cont a i n i n g charged flavonoid-compounds of a l l t y p e s , which may be more widely d i s t r i b u t e d t h a n h i t h e r t o b e l i e v e d , may pay handsome d i v i d e n d s ( 8 1 and 115).
RUTIN
675
References 1.
The Merck Index, 9th Edn. Martha Windholz, Merck Inc., Rahway, N . J . , U.S.A. (1976).
Co.
2.
W. Karrer, "Konstitution and Varkommen der Organischen Pflazenstoffe", Birkhauser Verlag, Basel und Stuttgart, (1958).
3.
Youngken, H.W., "Pharmaceutical Botany", 7th Edn. Blakiston Co. Philadelphia, (1951).
4.
L.P. Miller, "Phytochemistry" Vol. 11, Van Nastrand Reinhold Co., (1973).
5.
Pharmaceutical Codex , 11th Edn. Press, London, (1979).
6.
J.F. Couch, J . Naghski, and C.F. Krewson, U.S.A. Bar Agric. and Industr. Chem. Rpt. AIC-52, (1944).
7.
J.F. Couch, J. Naghski, and C.F. Krewson, Science 197, (1946).
8.
Martindale "The Extra Pharmacopeia", 27th Edn., The Pharmaceutical Press, London, (1978).
9.
B.P. 1980. "The British Pharmacopeia", Her Majesty Stationary Office, Cambridge, (1980).
10.
Index of Specialities, The Egyptian General Organization for Pharmaceuticals, Chemicals and Medical Appliances, Cairo, (1969).
11.
G. Zemplen, and A. Gerecs, Ber.,
&
The
The Pharmaceutical
103,
m, 1318, (1935).
12. Dictionary of Organic Compounds, 4th Edn., Vol. V, Eyre and Spottiswoode Publishers Ltd., (1965).
13. T.J. Ma:bry, K.R. Markham, and M.B. Thomas, "The Systematic Tdentification of Flavonoids", SpringerVerlag, Berlin, (1970). 14.
J.B. Harborne, "Phytochemical Methods", Chapman and Hall, London, (1976).
15.
J.Q. Griffith, Jr., "Rutin and Related Flavonoids'', Mack, Easton, Pa., (1955).
TAHA I. KHALIFA ETAL.
676
16. J.G. Grasselli, and W.M. Ritchy (Eds.), "Atlas of Spectral and Physical Constants of Organic Compounds", Vol. I, 2nd Edn., CRC Press, Inc., Ohio, (1975). 17. J.C. Chang, J. Org. Chem.
2,1881, (1976).
18. P. Joseph Nathan, J. Mares, M.C., Herandez, and J.N. Shodery, J. Magn. Reson., 16,447, (1974). 19. C.A. Kingsbury, and L.H. Looker, J. Org. Chem., 1120, (1975).
40,
20. F.W. Wehrli, J. Chem. SOC. Chem. Commun., 663, (1975). 21. H. Wagner, V.M. Chari, and J. Sonnenbichler, Tetrahedron Lett., 1799, (1976). 22. A. Pelter, R.S. Ward. and T.I. Gray., J. Chem. SOC. 2475, (1976). Perk.
r,
23. K.R. Markham, and B. Ternai, Tetrahedron, 32, 565, (1976). 24. K.R. Markham, and B. Ternai, Tetrahedron, 32, 2607, (1976).
41, (l), 17, (1978). 25. C.J. Chang, LLyodia, 26. E.B. Dechene, J. Am. Pharm. Ass. Sci. Edn., (1951).
40,
495,
27. F.Malyneux, Process Biochem., 23, (1971). 28. R. Plouvier, Compt. Rend.,
216, 459, (1943).
29. E. Ramstad, "Modern Pharmacognosy", McGraw-Hill, Book Co., Inc., New York, (1959). 30. E.W. Underhill, J.E. Watkin, and A.C. Neish, Can. J. Biochem. Physiol, 35, 219, (1957). 31. F.R. Humphreys, Economic Bot.,
18,(3),
195, (1964).
32. J.F. Couch, Dept. US Agric. AIC-202, (1948). 33. S.V. Kostanecki, V. Lampe (1904).
&
J. Tambos, Ber.,
34. J. Allan & R. Robinson, J. Chem. SOC.,
37, 1402,
127, 2334,(1926) .
677
RUTIN
35.
M.K. Shakhova, G . I . Samokhvalov and N.A. P r e a b r a z h e n s k i i Zh. Obshch. Khim, 32, 390, (1962), through C.A. 58, 1426e, (1963).
36.
R. Robinson, (1936), quoted through I . L . F i n a r , "Organ i c Chemistry", Vol. 2 , F i f t h Edn., p . 789, Longman, London, (1975).
37.
A . J . B i r c h and F.W. Donovan, A u s t r a l . J. Chem., 360-368, (1953).
38.
H. Grisebach and K.O. 753, (1963).
39.
O.L.
Vollmer, Z. N a t u r f o r s c h ,
6,
186,
Gamborg, and C. Neish, Can. J . Biochem. P h y s i o l . ,
37, 1277, (1959).
90,
40.
R.H.
Wilson, J. Pharmacol.,
41.
R.H.
Wilson, Science,
42.
A.M. Ambrose,
43.
A.M.
Ambrose,
44.
A.M.
Ambrose,
45.
F.A. Fuhrman, J . C l i n . I n v e s t . ,
46.
A.M. Ambrose, Fed. Proc.,
47.
R.H.
48.
Horrison e t a l , J. Am. Pharm. ASSOC., through Ref. No. 1.
49.
J. Naghski, M . J . 34, (1947).
50.
f b i d , Science,
51.
H.W. F l o r e y , E. Chain, N.G. Heatley, M.A. J e n n i n g s , A.G. Sanders, E.P. Abraham, and M.E. F l o r e y , " A n t i b i o t i c s " , Oxford Univ. P r e s s . , Vol. I, (1949).
52.
A. K h a t i b i , T.I. K h a l l f a , F . J . Muhtadi, and M.M.A.Hassan, Unpublished R e s u l t s .
53.
R.L.
120, (1947).
107,369, (1948). Fed. Proc., 1, 203, (1948). J. Pharmacol., 97, 115, (1949). J. Pharmacol., 90, 353, (1947).
Wilson, Science,
2,
27,
364, (1948).
(1950).
107, 369,
(1948).
2, 557,
(1950);
Copley, and J . P . Couch, J. Bact.,
105,125,
54,
(1947).
Sheno, Amer. J. Med. S c i . ,
211,
359, (1946).
TAHAI. KHALIFA ETAL.
678
42,
54.
J.Q. G r i f f i t h , J . Am. Pharm. A s s . , 68, (1953).
55.
J.Q.
G r i f f i t h , Blood,
56.
J.Q.
G r i f f i t h , P r o c . SOC. Exp. B i o l . N . Y . ,
57.
J . Q . G r i f f i t h , Proc. SOC. Exp. B i o l . N . Y . , (1947).
58.
J . J . Burns, i n L.S. Goodman & A. Gilman ( E d s . ) , "Pharmacological Basis of T h e r a p e u t i c s " , 3 r d Edn., Macmillan, N e w York, (1965).
59.
C.O. Wilson, 0. G i s v o l d , and R.F. Doerge, "Textbook of O r g a n i c , M e d i c i n a l and Pharmaceut l c a l Chemistry", 6 t h Edn., J . B . L i p p i n c o t t Co., P h i l a d e l p h i a , (1971).
60.
J . T . Haley, and B.M. Rhodes, J. Am. Pharm. A s s . , Ed., 40, 179, (1951).
61.
M.E. S h i l s , and R.S. Goodhart, "The F l a v o n o i d s i n Biology and Medicine", N a t i o n a l Vitamin Foundation, New York, (1956).
62.
F. DeEds, i n J.W. F a i r b a i r n (Ed.), "The Pharmacology of P l a n t P h e n o l i c s " , Academic P r e s s , London, (1959).
63.
C.W. Murray, A.N. Booth, and F. DeEds, and F . T . J o n e s , J. Am. Pharm. A s s . , S c i . Ed., 43, 361, (1954).
5,
S c i . Edn.,
558, (1951). 64, 3 3 2 , ( 1 9 4 7 ) .
64,338,
Sci.,
64. A.N. Booth., C.W. Murray, F.T. J o n e s and F. DeEds, J. B i o l . Chem.,
65.
66.
251, (1956).
F. DeEds, A.N. Booth, and F.T. J o n e s , J . B i o l . Chem. 615, (1957).
225, A.N.
Booth, O.H.
J. B i o l . Chem.,
67.
223,
A.N.
230,
Emerson, F.T. J o n e s , and F. DeEds, 51, (1957).
229,
Booth, F.T. J o n e s , and F. DeEds, J. B i o l . Chem., 661, (1958).
5,
68.
T. I t a i , and S. Kamtya, Anal. A b s t r . ,
69.
S. Kamiya, Japan A n a l y s t . , 7 ( l l ) , 717, (1958); t h r o u g h Anal. A b s t r . , 6, 3674, (1959).
70.
A.A. S h e h a t a , Dept. of Pharmacognosy, C o l l e g e of Pharmacy, King Saud U n i v e r s i t y , P e r s o n a l Communication.
3590, (1950).
RUTIN
71.
72. 73.
679
P.L. Armentano, A. B e n t s a t h , T . Beres, S . I . Ruoznyak, and A. Szent-Gyorgi, Deut. Med. Wachschr, 62, 1325, (1936). E. Kolos, Acta Pharm. Hung., 35, ( 5 ) , 225, (1965); t h r o u g h Anal A b s t r . 14,361, (1967).
U. Bilinska-Kozicka and J . T e r p i l o w s k i , Dissert. Pharm., Krakow, 14, ( 4 ) , 467, (1962); t h r o u g h Anal. A b s t r . , 10, 3852, (1963).
74.
t h r o u g h Anal. A b s t r . 75.
15, (2), 3882, (1958).
U. B i l i n s k a , Acta Polon Pharm.,
, 5,
123, (1958);
T . Bross and U. B i l i n s k a , Acta Polon Pharm., 15, ( l ) , 39, (1958); t h r o u g h Anal.Abstr. 5, 334, (1959).
23,
76.
M. Sakamoto, and K . Takamura, Microchem. J . , (1978).
77 *
K. Takamura and Sakamoto, M . , ( 8 ) , 2291, (1978).
78.
D.G. C o n s t a n t i n e s c u , R. O t e l e a n u , and G . B a i k l e s c u , Stud. C e r c e t . S t i i n f . Chim. I s a i , 8, (l), 8 9 , ( 1 9 5 7 ) ; through Anal.Abstr. 6, 488, (1959).
79.
J . Davidek, Bio-Khimiya,
80.
V. Dorneau, M. L a z a r , C . Ghimicesu, and E. G r i g a r e s c u , Rev. Med. C h i r , 78,( 4 ) , 929, (1974).
81.
T. Sarwin i n T.W. Goodwin ( E d . ) , "Chemistry and Biod h e m i s t r y of P l a n t Pigments", V o l . 11, Academic P r e s s , New York, (1976).
82.
C.N.
83.
0. Kozarynowa and B . Owezarska, Herba Anna,
Chem. Pharm. B u l l . ,
26, (l),
Wilson, J . h e r . Chem. SOC.,
301, (1977); t h r o u g h C.A.
(3),374,
26,
93, (1961).
61,
2303, (1939).
9, (17-18) ,
23, ( 4 ) , 152776h, (1978).
84.
J. Lutomski, W. Raszejowa, and M. J a s t i z e b s k a , D i s s n e s . Pharm. Warsz., 19, ( 4 ) , 417, (1967).
85.
F. Braven, W. Heinmann and A. Z e i g l e r , Z . Anal. Chem., 2 1 7 , ( l ) , 22, (1966); t h r o u g h Anal. A b s t r . , 14,3576, (1967) .
86
T . I . K h a l i f a , M.M.A. Results
.
Hassan and F . J . Muhtadi, Unpublished
680
TAHA I. KHALIFA E T A .
87. N.A. Tyukavkina, A . I . K i r i l l o v , K . I . Lapteva, and N.G. Devvatkb. I z v . Sib. Otdel. Akad. Nauk. SSSR, Ser Khim. Nauic., 1; (2), 121, (1969); through Anal. Abstr. l8,
2535, (1970). 88. J. Lutomski, B. Malek, and 2. Stachowiak, Herba P o l . , 18,(22, 162, (1972); through Anal. Abstr. 24, 1810, (1973). 89. Von B. Glotzbach, and H. R i m p l e r , P l a n t a Medica, (1968).
2, 1,
90. J. Davidek, and 0. Manousek, Ceskosl. Farm., 7, (2), 73, (1958); through Anal. Abstr. 5, 3883, (1958). 91. I b i d , Sb. Vys. Sky Chem. Technol., Odd. Fak, P o t r a v . Technol, 5, (2), 87, (1962); through Anal.Abstr. 4835, (1962).
z,
92. M. Cine, T. Rodboj, K. Lomovsek, and F. Kozjek, Farm. Vestn, 28, (l), 23, (1972); through C.A. 87, (25-261, 2065, 65t, (1977). 93. C.N. Rodwell, Nature, ,&I
773, (1950).
94. J. Naghski, C.S. Fenske, Jr. , C.F. Krewson, and J.F. Couch, US Dept. Agr. Bur. Agr. Ind. Chem. A I C , 236. 95. C.E. Sando, and H.H. 495, (1920).
B a r t l e t t , J. B i o l . Chem.,
41,
96. J. Michal, Call. Czech. Chem. Commun., 21, (3), 576, (1956); through Anal. Abstr. 4, 23, (1957). 97. R. Leu, and P. Hagedorn, 2. Anal. Chem., 139, (2), 96, (1953); through Anal. Abstr. 1, 588, (1954). 98. Y . Okay and S. Mat suo, J. Chem. SOC. Japan, Pure Chem. S e c t . , 2, (6), 610, (1955); through Anal. Abstr. 2, 671, (1956). 99. J . R . Wiebush, Dissert. A b s t r . ,
2, (l),
20, (1956).
100 J. Michal, Chem. L i s l y , 48, (4), 621, (1954); through Anal. Abstr. 2, 1187, (1955). a
101. E.C. Bate-Smith, "Biochemical Symposium No. 3", Cambridge, Cambridge Univ. P r e s s , (1950). 102. J. B. Harborne, J. Chromatog.,
2, 581,
(1959).
681
RUTIN
103. T.B. Gage, C.D. D o r i g l a s s , and S.H. IJender, Anal. Chem., 23, 1582, (1951). 104. P , Riberau-Grayon, "Plant Phenolics", Oliver and Boyd, Edinburgh, (1972). 105. F. Tomas, P. Gomez, J.J. Mataix, and 0. Carpena, Revta Agroquim. Technol. Aliment, 2, (l), 106, (1972) ;through Anal. A b s t r . , 24, 1766, (1973). 106. 2. Deyl, K. Macek, and Janak, J . , (Eds.), "Liquid Column Chromatography", E l s e v i e r S c i . P u b l i s h i n g Co., (1975). 107. J . B .
Woof, and J . S .
Pierce, J. Chromatogr.
108. K.M. Johnston, D . J . S t e r n , and A.C. matogr., 33, 540, (1968). 109. A.W..Fraster, and J . R . (1973). 110. H.M. Hurst, and J.B. (1967).
28, 94, (1967).
Waiss, Jr., J . Chro-
L e w i s , Phytochemistry,
2, 1787,
Harborne, Phytochemistry,
111. H. C. Chiang, Yu Lin, and Y.C. 161, (1969).
6,
Wu, J. Chromatogr,,
1111,
45,
112. C.G. Nordistorm, and T. Kroneld, Acta Chem. Scand., 2237, (1972). 113. R.A. Andreson, and T.H. Vanghan, J. Chromatogr., 385, (1970). 114. J . R . Walka, and J . E . (1969).
Thompson, Lab. P r a c t . ,
115. R.G. Williams, J . H . Bowie, and D.H. ron. 24, 1407, (1968).
26,
42,
2, 629,
Williams, Tetrahed-
TRIMIPRAMINE MALEATE Abdullah A . Al-Badr 1 . Description 1 . 1 Nomenclature 1.2 Formulae 1.3 Molecular Weight 1.4 Elemental Composition 1.5 Chemical Abstract Registry Number 1.6 Appearance, Color, and Odor 2. Physical Properties 2. I Melting Point 2.2 Solubility 2.3 Identification 2.4 Spectral Properties 3. Synthesis 4. Metabolism and Excretion 5. Methods of Analysis 5.1 Titrimetric Methods 5.2 Spectrophotometric Methods 5.3 Polarographic Method 5.4 Chromatographic Methods References
ANALYTICAL PROFILESOF DRUG SUBSTANCES VOLUME 12
683
684 684 684 685 685 685 685 685 685 685 686 687 696 699 699 699 700 702 702 710
Copyright by thc American Pharmaceutical Association ISBN 0-12-269812-7
ABDULLAH A. AL-BADR
684
1. Description 1.1 Nomenclature 1.11 Chemical Names
-
lO,ll-Dihydro-N,N,B-trirnethyl-5H-dibenz[b,f] azepine-5-propanamine hydrogen maleate
-
5-[3-(Dirnethylamino)-2-methylpropyl]-l0,11dihydro-5H-dibenz[b,f]azepine hydrogen maleate
- 5-(3-Dimethylamino-2-methylpropy)iminodibenzyl hydrogen maleate
-
3-(lO-ll-Dihydro-5H-dibenz[b,f]azepine-5-y1) -2-methyl-propyl-N,N-dimethyl ammonium hydro -gen maleate
-
5-(3-Dimethylamino-2-methylpropy)-lO,ll-dihydro-5H-dibenz[b,f]azepine hydrogen maleate
-
Trimipramine acid maleate
-
Trimipramine hydrogen maleate
1.12 Generic Names Trimepramine,Trimeprimine, Trimeproprimine RP 7162, Sapilent. 1.12 Trade Names Stangyl, Surmontil 1.2 Formulae 1.21 Impirical 2OH26N2 C20H26N2y ‘qH4’4
(base) (maleate salt)
TRIMIPRAMINE MALEATE
685
1.22 Structural
lo
11
CH COOH t
CH3
CH COOH
CH3
1.3 Molecular Weieht Trimipramine Trimipramine Maleate
294.42 410.5
1.4 Elemental Composition C C
81.58% H 70.22% H
8.90% N 7.36% N
9.52% 6.82% 0
(base) 15.60% (maleate)
1.5 Chemical Abstract Reeistw Number [ 739-71-91 [521-78-81
base maleate salt
1.6 Appearance, Color and Odor
A white crystalline, powder, odorless or almost odorless (1). 2.
Physical Properties 2.1 Meltine Point Trimipramine 45O Trimipramine maleate 140-144' 2.2
(21 (1)
Solubility Trimipramine maleate is slightly soluble in water and in ethanol (96%); freely soluble in chloroform; practically insoluble in ether (1).
ABDULLAH A . AL-BADR
686
2.3 Identification Clarke (2) described the following tests:
I)
Trimipramine can be identified by forming crystals with platinic chloride solution where needles, often serrated are formed (sensitivity: 1 in 1000). Trimipramine also forms dense rosettes with trinitrobenzoic acid solution (sensitivity 1 in 1000).
11)
Trimipramine can be identified by the following color tests:
- Ammonium molybdate test; blue color is produced (sensitivity 0.1 ug) . - Ammonium vanadate test; blue color is produced (sensitivity 0.1 pg) .
- Vitalits test; deep greenlyellowlyellow (sensitivity 0.1 pg) .
The following tests are cited in both European Pharmacopoeia 1975 (3) and the B.P. 1980 (1) for the identification of trimipramine maleate: a) To 0.1 g add 2 ml of alcohol, heat to boiling and add 1 ml of a standard solution of picric acid in alcohol. Scratch the walls of the tube with a glass rod until crystallization begins. Allow to stand for 15 minutes, filter, wash the precipitate with alcohol and dry at 100" to 105". The picrate has a melting point of 131'. b) Triturate 0.1 g with 3 ml of water and 1 ml of strong sodium hydroxide solution and extract with three quantities, each of 5 ml of ether. To the aqueous solution add 2 ml o f bromine solution. Heat in a water bath for 10 minutes, then heat to boiling and cool. Add to 0.1 ml of this solution, a solution of 10 mg of resorcinol in 3 ml of sulphuric acid and heat on a water bath for 2 minutes, then cool. A deep blue color develops.
687
TRIMIPRAMINE MALEATE
c) A 0.002 per cent w/v solution in 0.1 N hydrochloric acid, examined between 230 nm and 350 nm, shows a single absorption maximum at about 250 nm. The extinction at the maximum at about 250 nm in a 1 cm cell is about 0.42. The following test is cited in the European Pharmacopoeia 1975 (3). Dissolve about 5 mg in 2 ml of nitric acid; an intense blue color is produced whichturns green on standing. 2.4 Spectral Properties 2.41 Ultraviolet Spectrum The ultraviolet spectrum of trimipramine maleate in neutral methanol solution in the region of 200 to 350 nm exhibits a maximum at 247 nm and a minimum at 233 nm. The spectrum is shown in Figure 1. Trimipramine in 0.1 N sulphuric acid exhibited 1 cm 300) and an ina maximum at 250 nm (E 1%’ flexion at about 268 nm (E 1 cm 250) (2). 1%’ According to B . P . 1980 (2) the UV spectrum of trimipramine maleate of a 1 cm layer of 0.002 percent w/v solution in 0.1 M HC1 exhibits a maximum only at 250 nm and an absorbance at 250 nm, about 0.42. 2.42 Infrared Spectrum The infrared spectrum of trimipramine maleate is shown in Figure 2. The spectrum was obtained as KBr disc. The structural assignments have been correlated with the following band frequencies: -1
Frequency(cm
1
Assignment
3430
N-CH3
3057
Aromatic CH stretch
2949, 2825
Asymmetric and Symmetric CH stretch
688
c
0
B O
1
0
m
689
s
0
1
0
L
N
ABDULLAH A. AL-BADR
690
2921, 2852
Asymmetric and Symmetric CH2 stretch.
1620, 1570
Aromatic C=C stretch.
Other finger print band characteristics to trimipramine (determined in KBr disc) are 1351, 1488 and 1580 cm-' (2). 2.43 Proton Nuclear Magnetic Resonance Spectrum (PMR) The 60 MHz spectrum of trimipramine maleate in deuterated dimethylsulphoxide is shown in Figure 3. The spectrum was determined in Varian T60 A NMR Spectrometer with tetramethylsilane (TMS) as reference standard. Assignment of the bands are as follows: Chemical shift ppm
Multiplicity
Assignment
0.98
d
CH2-CH(CH -3 ) -CH2-
2.8
S
-N
/CH? \
CH,
3.1-3.9 m (unresolved)
Methylene protons.
6.15
S
CH=CH (ma1eate)
7.05
m
Aromatic protons.
s:
singlet; d: doublet; m:multiplet.
Proton magnetic resonance was reported t o be useful for the identification of trimipramine and some other tricyclic psychotropic drugs. The drug can be characterized by examining the signal given by the protons of the ring and side chain. It is also reported that NMR spectrometry is a technique of choice for the rapid identification of the drug (4).
s 3
U .d
Q)
01
m
U
ld E
4
.. Q)
r-7
M
L 3
692
ABDULLAH A . AL-BADR
2.44 13C-Nuclear Magnetic Resonance Spectrum(”C
NMR)
The I3C-NMR spectrum of trimipramine maleate in deutrated chloroform using tetramethylsilane as an internal reference is obtained on a Jeol FX 100-100 MHz at an ambient temperature using 10 mm sample tube. The spectrum is shown on Figure 4 and the carbon chemical shift values, shown in Table 1 are derived from the off-resonance spectrum.
.7 i a
CH COOH
II
CH COOH
Table (1) 13C-NMR characteristics of trimipramine iiialeate Carbon No. Chemical Shift Carbon No.
(PPI
Chemical Shift (PPm)
1
126.96
11
32.06
9
126.96
’‘a
133.81
2
119.48
8
119.48
12
54.38
3
130.12
13
27.68
7
130.12
14
16.76
4
135.56
15
62.47
6
135.56
16
43.27
4a
147.45
17
123.19
6a
147.45
18
169.27
10
32.06
‘la
133.81
I I
Figure 4 :
PPM (6)
Carbon-13 NMR Spectrum of Trimipramine maleate in CDC13 with TMS as internal reference.
TMS
694
ABDULLAH A. AL-BADR
2.45 Mass SDectrum and F r a m e n t o m e t r y The mass spectrum of t r i m i p r a m i n e m a l e a t e (Figure 5) o b t a i n e d by e l e c t r o n impact i o n i s a t i o n , u s i n g Finnigan mass s p e c t r o m e t e r shows a molecular i o n M+'at m / e 294 ( r e l a t i v e i n t e n s i t y 2 5 % ) . Table (2) shows t h e proposed f r a g mentation of t r i m i p r a m i n e . Table (2) Proposed fragmentation of trimipramine ( E I )
m le
294
Relative intensity %
ion
-
l+*
25 kH2CH-CH2
I
p
CH3 249
100 CH-CH= CH2 I
CH3 234
35 CH-CH=CH2
208
50
193
70
3
-N\
m'
CH3
Fig. 5 .
Mass Spectrum of Trimipramine maleate (EI).
696
ABDULLAH A. AL-BADR
ion
Re1ative intensity % 65
,
0 CH2-CH-CH=N + CH3
\
t
CH3 84
63
72
32
58
82
CH3
+ ,CH3 CH2=CH-CH=N \
+ HCH3 CH-N l \ CH3 CH3
+ NCH3
CH =N
2 \
CH3
Cailleux and Allain (5) reported that chemical ionisation was superior to electron impact for identification of four drugs including trimipramine, by gas-chromatography-mass spectrometry. The drugs cannot be separated by GLC at 220' on an SE 30-Chromosob column, nor can they be unequivocally distinguished by electronimpact mass spectrometry. Spectra are reproduced to show that these drugs can be clearly distinguished by chemical ionisation-mass spectrometry with CH4 as reagent gas. 3. Svnthesis Trimipramine can be synthesized by the following methods: Condensation of lO,ll-dihydro-5H-dibenz[b,f] azepine and (CH3) 2NCHZCH(CH3)CH2C1 in toluene with sodamide (6) ( 7 )
a)
@& A
/CH3 *C1CH2-CH-CH2 -N\ CH3
toluene* Trimipramine NaNH2
6?7
TRIMIPMMINE MALEATE
b)
Decarboxylatlon of the 5- [ [CH3) 2NCH2CH(CH3)CH20CO] derivative of l0,ll-dihydro-5H-dibenz [b,f]azepine(6)
I
COOCH~CH-CH~-N(
CH
-co2
I
c)
:Trimipramine
CH3 CH3 Reaction of the 5- [ C H J S O ~CH2CH(CH3)CH2] derivative of lO,ll-dihydro-5H-dibenz[b,f] azepine with dimethylamine (6).
x
I
CH CH2CH-CH2-S-OCH3+ H-N( 3, Trimipramine I I1 CH3 0 CH3
d)
By the general method described by Budai et a1 (8) according to the following scheme:
C1-COOC H 2
+ C1-CH2-CH-CH2N\ 5 I CH3
:1CH, -CH-CH, -N,
CH3 absolute benzene CH3
,COOC2H5 r,,
,
COOC2H5 ~H~CH-CH~N, I CH3 CH3
CH2CH-CH N 1 'CH3 CH3
698
ABDULLAH A . AL-BADR
10
CH3+
OCH3
0
I
Toluene, K2C03
-+ CH2CH-CH-N,CH3 I 0 CH3 1
2
CH3 e)
l0,ll-Dihydro 5H-dibenz [ b , f ] azepine was converted to its 5-COC1 derivative by the reaction with phosgene. This product was allowed to react with HOCH2CH (CH )CH2-N(CH ) to form 5 - (3-dimethylamino-2metgylcarboxy?a$e) intermediate. The latter is dicarboxylated to give trimipramine ( 9 ) .
m
ClCOCl
I
H
CH 1 3 / CH3 HO-CH2-CH-CH2 -N \
I
CH3
c ~
-
4 I
t0Cl
@Q-+ I JH3 COOCH2CH-CH2N, I CH3 CH3
ICH2CH-CH2N,0 CH3 I
CH3 Trimipramine
c*3
TRIMIPRAMINE MALEATE
699
4. Metabolism and Excretion Studies on rabbits and dogs ..ave shown that trimipramine is extinsively metabolized (2). Populaire et a1 (10) reported that, after oral ingestion of trimipramine, both the drug and its monodemethylated derivative were found in the circulating blood of dogs and rabbits; the concentration in the blood were low, and maximum concentrations were reached within the first 6 hours. Within 72 hours, dogs excreted 1.5-8% of the ingested dose,(50-70% in the conjugated form), in the urine and 2-25% in the feces; the corresponding values in rabbit were 10-20% (90%) and ~ 2 respectively. % At least 26 metabolites were detected in the excreta. The metabolism of trimipramine in humans and animals appeared to be similar. 5. Methods of Analysis 5.1
Titrimetric Methods a) Aqueous Titration Potassium hexathiocyanatochromate K3Cr(SCN)6 was used (11) in the determination of trimipramine. The reagent precipitated trimipramine base (HB) as Cr(SCN)6 H3-3B and the excess reagent was titrated with KBr03. The method was suitable €or analysing 6-20mgsamples with relative deviation of 0.2-0.8%. b) Non-Aqueous Titration B.P. 1980 (1) and European Pharmacopoeia 1975 (3) determined trimipramine by the non-aqueous titration with 0.1 N perchloric acid using crystal violet solution as an indicator. c) Oscillometric Titration Pomazanska - Kolodziejska (12) reported the use of an oscillometric method for titration of trimipramine among other related pharmaceutical compounds with HC1 in acetone/ethanol solution.
ABDULLAH A. AL-BADR
700
5.2 Spectrophotometric Methods 5.21 Nuclear Magnetic Resonance Spectroscopy A new method was described (13) for the assay of trimipramine maleate and its base using 1H NMR technique. The method employed is precise, accurate, rapid and helpful in qualitative identification and purity of the drug. 5.22 Fluorescence-Phosphoresence Trimipramine, among other dibenzazepines, gave with KMnO4, a green fluoresence which can be used f o r analytical purpose (14) with a sensitivity of >0.06-0.1 y/ml. et a1 (15) studied the luminesence Gifford -characteristics of trimipramine and several classes of drugs affecting the central nervous system. The compound was studied in ethanol at at 77K. The characteristics for trimipramine are : Excitation maxima 300 nm, the phosphoresence maxima 450-470 nm and the phosphoresence life time 0.70 sec. 5.23 Colorimetric Methods a) French et a1 (16) reported a colorimetric analysis of some dibenzazepines including trimipramine. The determination of these drugs has been studied by: 1. Treatment in acid solution with HN02 and measurement of the extinction of the reaction mixture at 390 nm. 2. Addition of bromothymol blue to solution buffered at pH 7 and extraction with benzene, with measurement of the extinction of the benzene extract at 410 nm. 3. Direct measurement of the extinction of the acid solution at 251 nm. The analysis
701
TIUMIPRAMINE MALEATE
by the three methods was used for the assays of tablets and injections. Although all the three methods have essentially the same accuracy and precision for bulk drugs, the colorimetric procedures are less subject to interfere by other material (e.g. U.V. absorbers) that may be present ill pharmaceutical preparation. b) Slunjski and Turkovic (17) reported that the reaction between 32% HNO3 and trimipramine produces a blue color which, after several minutes, changes to yellow. After evaporating off the solution to dryness on a water bath, dissolution of the residue in alcoholic KOH produces a stable red violet color exhibiting maximum absorption at 560 nm. The reaction can be used to determine 0.3 to 1.2 mg of drug in dragees or down to 1 ppm of the drug or its metabolites in urine, and is specific for compounds of this structure (e.g . imipramine, desipramine and trimipramine). c) Klinge and Beyer (18) reported a simple method for detection and determination of trimipramine and its derivatives in chemical toxicology. The drug is extracted from blood, urine or body tissue extract into chloroform in the presence of Na2C03. After evaporation of chloroform, the residue is dissolved in warm 80% acetic acid (5 ml) and the solution is diluted to 10 ml with 80% acetic acid. The drug is determined by heating 5 ml of the solution with one drop of fresh 2% NaN02 solution in a boiling water-bath for 10 min and measuring the extinction of the stable yellow color at 415 to 420 nm. 5.24 Atomic Absorption Trimipramine, among other azepine bases, has been microdetermined by atomic absorption (19). The sensitivity of the method is 1-4 X 10⁻⁴M. The method involves the formation of an ionic complex between the drug and sodium dioctyl sulfosuccinate (DOSS). After the pH of the reaction medium is adjusted to protonate the drug, known
702
ABDULLAH A. AL-BADR
amount of DOSS is added to form an ionic complex with the drug. If the complex is sufficiently stable, the excess DOSS is complexed with Cu o-phenathroline. The latter complex is extracted with methyl isobutyl ketone and the Cu concentration is determined by atomic absorption, if DOSS-drug complex has low stability, it may be removed by extracting with CCl4 and the excess DOSS is then determined as described above. 5.3 Polarographic Method Volke et a1 (20) used a 3-electrode polarograph, with a rotating-dlsc indicator electrode (~1300rpm) and s.c.e., f o r the attempted anodic oxidation, of trimipramine and other related compounds. Acetonitrile media were used, with 0.1 M tetrabutylammonium perchlorate as supporting electrolyte. At both platinum and gold indicator electrodes, 5.4 Chromatographic Methods 5.41 Gas-Chromatography Clarke (2) reported the retention time of trimipramine to be 0.64 relative to codeine using 2.5% SE-30 on 80-100 mesh chromosob W A WHMDS, 5 feet X 4 mm id glass column. Clarke (2) also reported a retention times of trimipramine to be 0.30 (0.15) relative to codeine using 3% XE-60 silicon nitrile polymer on 100-120 mesh chromosob W. Viala et a1 (21) described a gas chromatographic technique f o r the identification of trimipramine using two types of columns, XE-60/ Igapal o r Aeropack and UNCON polar o r prealkalanized varport-30. The latter has the base o r the salt o f the compound in methanolic solution. A rapid method is given (22) f o r the extraction and identification of trimipramine and some other basic drugs as well as their metabolites in urine. Gas-Chromatography,(glass coil packed with 3% OV-17 on gas-chrom Q 100-120
TRIMIPRAMINE MALEATE
703
mesh, N carrier, flame ionization detector), was used as the primary source of identification. 5.42 Gas-Liquid Chromatography
Trimipramine was determined, among other tricyclic antidepressants., in biological fluids and tissues, by gas-liquid chromatography: a) Reite (23) published a gas-liquid chromatography method for the determination o f trimipramine and its main metabolite (monodesmethyltrimipramine) in human serum using nitrogen detection. The drug and its main metabolite were extracted from the serum with hexane and the metabolite wasderivatized with trifluoroacetic anhydride. b) Dawling and Braithwaite (24) reported a simplified method f o r monitoring trimipramine among some tricyclic antidepressant therapy using gas-liquid chromatography with nitrogen detection. The column was silanized glass packed with 3% SP 2250 on supelcoport, tarrier gas was Ar, and the internal standard was maprotiline-HC1. c ) The pharmacokinetic characteristics, o f two
different formulations (capsule and tablets) of trimipramine, were determined with a new gas-liquid chromatographic method ( 2 5 ) . Plasma plus amidopyrine (internal standard) is mixed with 10 M NaOH and extracted with hexane; the separated organic phase is dried and evaporated at 60" under nitrogen. A solution of the residue in ethyl acetate is analyzed by GLC on a solumn ( 6 ft X 2 mm) of Gas Chrom-Q(80-100 mesh) supporting 3% of OV-17, with nitrogen ionisation detection. After 9.5 min at 225' the column temperature is increased to 275' (maintained f o r 5 . 5 min) in 2 min; retention times are 4.05 min for amidopyrine and 8.15 min for trimipramine.
5.43 Column Liquid Chromatography
Van den Berg (26) described a column liquid chromatography system for the analysis of tri-
ABDULLAH A. AL-BADR
704
cyclic antidepressants including trimipramine.
A high separation efficiency can be obtained
with a mixture of ethyl acetate, n-hexane, and methylamine as eluent on a silica gel column. The retention is easily regulated by varying the concentration of n-hexane, the modifier methylamine, and the H20 content of the ethyl acetate. Ultraviolet detection permits determination down to the 10-ng level in the serum. 5.44 Paper Chromatography Clarke (2) described a solvent system consisting of citric acid: H20 :n-butanol (4.8 gm: 130 ml : 870 ml). The system may be used for several weeks, if water is added from time to time to keep the specificgravity at 0.843 to 0.844. Trimipramine gives an Rf value of 0.73. The spots can be located under ultraviolet light, blue fluorescence. Iodoplatinate spray and bromocresol green spray were used as strong and weak location reagents respectively. 5.45 High-pressure Liquid Chromatography Trimipramine, among other tricyclic antidepressant was separated by high performance liquid chromatography on silica gel column using an eluting solvent of dichloromethane n-hexane (1:l) to which 0.2% of isopropyl alcohol and 0.13% of propylamine were added ( 2 7 ) . De Zeeuw -et a1 (28) described a relatively simple and rapid procedures for the toxicological analysis of some commonly used tricyclic antidepressants including trimipramine. The methodology consisted of a single extraction from aqueous media at pH 10 with hexane followed by high-performance liquid chromatography (HPLC) on silica gel using straight phase system. Uges and Bouma (29) determined trimipramine and its metabolites in serum by straight phase HPLC. The drug was separated from solution or from serum by HPLC on a column of silica gel, using CH2C12:CH30H: buffer pH 3.2 (90:10:0.15) as the mobile phase. The internal standard was proma-
TRIMIPRAMINE MALEATE
705
zine-HC1 and the compound was extracted from serum with CHZC12 under basic condition. Alary and Villet (30) separated trimipramine by dichotomic extraction as a function of solvent polarity and pH and identified it by high-performance thin-layer chromatography and liquid chromatograph trimipramine was isolated by extraction with hexane in an alkaline medium (pH > 1 2 ) . Cyclohexane:ethanol:butanol-25% NH40H (80:20:10:1) was used as the solvent in TLC. Cyc1ohexane:ethanol:diethylamine (80:ZO:lO :0.25) was used as the solvent in high pressure liquid chromatography. et a1 (31) reported a chromatographic Villet method for separation of trimipramine among some psychotropic agents.The drug was separated by a micro thin-layer chromatography method and a high-performance liquid chromatography method (Si 60 column, cyc1ohexane:ethanol:butanol:NHOH 25% (80:20:10:0.4) at 1.75 ml/mm transposed from the first method, The high performance liquid chromatography method has the advantage of simultaneous separation, identification and quantitation. Table (3) shows various high pressure chromatography systems used for the analysis of trimipramine in biological fluids. 5.46 Thin-Layer Chromatography Several thin-layer chromatography methods for the separation and analysis of trimipramine have been described in the literature. Macek and Vecerkova (35) reported a new method for identifying 161 medicinals including trimipramine. The method involves separation of substances into groups by extraction first at a low pH, and at a high pH, and then using an ion exchanger. The further separation is then done with paper chromatography, with thin-layer chromatography also serving for identification of the individual compounds.
Table (3) High-pressure Chromatography Systems
Column
Mobile Phase
Flow
rate
Detector
Remarks
Ref.
20 cm X 4.6 mm Partisil 5 (mean Particle size 6 pm)
Methanol:2M-NHg: 1 M-NH4N03(27: 2 :1)
W 254 nm
can be applied to the (32) analysis of the drug and amitryptyline and to their metabolites in gastric fluids, blood and 1iver .
30 cm X 4.4 mm column packed with p Bondapack c18
35% acetonitrile in 45 mm KH2PO4 adjusted to pH 3.0 with phosphoric acid.
UV 235 nm
Retention time of the drug 11.8 min. The method is described to determine subtherapeutic to overdose level of the drug. Applied to other tricyclic antidepressant.
Fluorescence spectrometer.
The retention volume from (34) a point of injection for i 25 cm column with 3.7 1. The Xf (fluorescence wavelength) = 412 mm
Octadecylsilane Methanol : H20 -coated spheri(35 : 65) sorb.
1 ml/min-l
(33)
TRIMIPRAMINE MALEATE
I01
Clarke (21 described a solvent system consisting of strong ammonia solution; methanol (1.5:lOO). The system should be changed after two runs. Trimipramine gives an Rf value of 0.58. The chromatogram is visualized by acidified iodoplatinate spray. Groningsson and Schill (36) described a thinlayer chromatography of trimipramine as an ion pair with C1-, Br-, SCN- and ClO4- as the counter ionsin the aqueous phase. The stationary phase was a cellulose powder impegnated with the solution containing the counter ion. The mobile phases are chloroform, cyclohexane + 1pentanol (7:3), cyclohexane + 1, pentanol (1:l). The visualization was made using Rhodamine B and Iodine. Table (4) show other thin-layer chromatography systems. 5.47 Thin-LayeT Chromatography-Mass Spectrometry Combined thin-layer chromatography-mass spectrometry technique was applied for the analysis of trimipramine (37). Thin-layer chromatography was carried out on glass plates coated with GF254 silica gel. The drug was applied to the plates from the stand.solvent. The solvent system consists of acetic acid:ethanol:water (30:50:20). The silica gel containing the drug was removed from the plate and inserted into the mass spectrometer. The highest m/e in mass spectrum of TLC sample was m/e 294.
Table (4) Thin-layer chromatographv systems for trimipramine analysis Stationary Phase
Developing Solvent
I
Detecting Agent ~
~~
Remarks
Rf value
Silica gel
Acetone: methanol: NH40H 50: 50 : 1
Alc. FINO3
Silica gel (activated)
Dehydrated peroxide-free ether: acet0ne:diethylamine (9O:lO:l) Benzene:acetone (100: 20) shaken with 10 ml of 5% aq. NH solution. 3
Spraying with Fluorescence can 0.170 dil. iodobe performed after platinate 24 hours. Teagent in Positive results 0.154 N-HC1 follow- are obtained with 100 mg of the proed by 50% H2SO4 and duct. examlning under U.V. radiation.
Kieselgel G
1) Methano1:acetone [12:88) 2) Ethano1:tetrachloroetfiane (16:84) 3) Methanol :benzene (31.7:68.3) 4) Ethanol :toluene (68:32) 5) Methano1:cyclohexane:ethyl acetate (17.8:33.6:48.6)
~~~~
I
Ref.
0.54 (39)
~
W light (254 mm after spray with Dragendorff's reagent).
0.4
0.8 0.65 0.5 0.64
I
Contd.. . .
Stationary
Developing Solvent
Detecting Agent
Remarks
Rf
Ref.
valut
Silica gel G
Hexane:anhydrous diethylamine (93:7)
55% H3PO3 saturated wl’th KC104 and heat.
It is possible to identify a psychotropic drug in urine in the event of toxicological emergency.
-
(41)
Kieselgel GF254
-Ether:acetone:ethyl acetate: diethylamine (85 :11 :2 :2) -Benzene:acetone:diethylamine (50 : 10 : 5) -Methanol:cyclohexane:Methyl acetate (17.8 :33.6:48.6]
Iodine vapour Bromlne vapour
Used for rapid identification. Used for rapid identification. Used for the identification of the tertiary amine.
-
(42)
-Butanol:toluene:methanal: H20 : acetic acid
-
(22:48:18:7:5)
Kieselge - 1 60F254
Cyc1ohexane:ethanol:butanol: 25% NH40H (80:20:10:0.4)
-
0.61
~
Kieselgel GF 254
Methanol:25% aq.NH3 (100 : 1)
-W radi-
ation -Spray witl 5% NaN02 soln. in 80% methanol.
-
ABDULLAH A. AL-BADR
710
6. References
1.
British Pharmacopoeia 1980, London Her Majesty's Stationary Office, 1980, p.466.
2. E.G.C. Clarke, "Isolation and Identification of Drugs" The Pharmaceutical Press, London, 1975, p.587. 3. "European Pharmacopoeia", V01.111, Maisonneuve, S.A. Saint - Ruffine, France, 1975, p.357.
4. J. Poirot-Lagubeau, P. Mesnard, P. Gerval, E. Frainnet, and M. Petraud; Ann.Pharm. 33, 279 (1975). - FT., J. Anal. Toxicol., 3 , 39 5. A. Cailleux and P. Allain, (1979). 6. R.M. Jacob and M. Messer, Compt. Rend., 252, 2117 (1961).
7. H. Wunderlich, E. Carstens, A. Stark, H.J. Heidrich and S. Henker, Ger. [East) 130, 712 (1978), through Chemical Abstractgo, - 103863W (1979). 8. Z. Budai,P.Benko and L . Pallos, Ger. Offen. 1, 920 170, 29 Jan. 1970, through Chemical A m c t 72 (1972). 9. Societe des usines chimiques Rhone-Poulene, Fr.1,172,
014 Feb.,4,1959 through Chemical Abstract 54, 19730i (1960).
10. P. Populaire, B. Terlain, S. Pascal, G. Lebreton and B. Decouvelaere, --Prod.Probl.Pharm. 25, 632 (1970). 11. A. Olech, Acta Pol.Pharm., 32, 73 (1975).
12. T. Pomazanska-Kolodziejska, -Farm. Pol., 30, 1005 (1974). 13. A.A. Al-Badr and S.E. Ibrahim, Spectrosc. Lett. -12, 419 (1979). Chem., 45, 75 (1967). 14. E. Adonai Martin, -Can. J. 15. L.A. Gifford, J.N. Miller, J.W. Bridges and D.T. Burns, Talanta,24, - 273 (1977).
711
TRIMIPRAMINE MALEATE
16. W . N . French, F . Matsui and J . F . T r u e l o v e , J. _ Pharm. _ _ -S c i 3 , 33 (1968). 17. M. S l u n j s k i and I . Turkovic, -J . Pharm. B e l g . , 25, 400 (1970). 1 8 . D . Klinge and K . H .
Beyer, D t . ApothZig., 108, 780, (1968).
19. J . A l a r y , A. V i l l e t and A. Coeur, Ann.Pharm. 34, - Fr., 419, (1976). 20. J. Volke, M . M . E l - L a i t h y and V . Volkova, J.E l e c t r o analyst. Chem.,-60, 239 (1975). 2 1 . A. V i a l a , J.P. Cano, C . Gola and F . Gouezo, J . Chromatog r , 59, 297, (1971). 2 2 . L.J. Dusci and L . P . (1979).
Hackett, Clin. Toxicol.,
14,587
23. S . F . R e i t e , Medd. Nor. Farm. Selsk., 37, 148 (1975). 2 4 . S. Dawling and R . A . (1978).
Braithwaite, J . Chromatogr, 146, 499
25. G . C a i l l e , J . G . Besner, Y . Lacasse and M . Vesina, Biopharm. Drug Dispos. 1, 187 (1980). -26. J . H . M . Van den Berg, H . J . J . M . De Ruwe, R.S. Deelder and T.A. Plomp; J. Chromatogr., 138, 431 (3977). 2 7 . M . R . D e t a e v e r n i e r , L . Dryon and D . L . Massart, J, Chromatogr., 128, 204 (1976). 28. R . A . De Zeeuw and H . G . M . 2 , 229 (1978).
Westenberg, _ J . -Anal. T o x i c o l . ,
29. D . R . A . Uges and P. Bouma, Pham. Weekbl., S c i . Ed. 1, 417 (1979). 30. J . A l a r y and A . V i l l e t , J . Pharm. Belg., 35, 408 (1980). 31. A V i l l e t , J. Alary and A. Coeur, T a l a n t a , 27, 659 (1980). 32. W . M . Hoskins, A . Richardson and D . G . Sanger; J. F o r e n s i c S O ~ . 17, , 185 (1977).
712
ABDULLAH A . AL-BADR
33. L.P. Hackett and L.J. Dusci, Clln. Toxicol.,l5, - 55 (1979). 34. L.A. King, J. Chromatogr., 208, 113 (1981). 20, 605 (1965). 35. K.Macek and J . Vecerkova, Pharmazie, -
Acta. Pharm. Suecica, 6, 36. K. Groningsson and G. Schill, 447 (1969). J. Chromatogr., 37. G.J. Down and S . A . Gwyn, -
103,208
3 8 . J.J. Thomas and L . Dryon, 9. Pharm. Belg.,
19, 481
(1975). (1964).
39. A.Viala, F. Gouezo and C. Gola, 9. Chromatogr., 45, 94 (1969). 40.
41.
E. Roeder, E. Mutschler and H. Rochelmeyer, J. Chrnmatogr.
42,
131 (1969).
J.J. Kebler, Bull. SOC. Pharm. 13, 41 (1970). - Strasbourg., -
42. J.A. Marca and
(1971).
H. Muehlemann, Pharm.Acta.Helv., 46, 558
ACKNOWLEDGEMENT
The author would like to thank M r . Mohammad Salim Feroze f o r typing the manuscript.
DIOCTYL SODIUM SULFOSUCCINATE Satinder Ahuja and Jerold Cohen 1. Description
1 . 1 Name, Formula, Molecular Weight, Elemental Composition 2. Physical Properties 2.3 Mass Spectrometry 2.8 Solubilization 2.9 Effect On Surface Tension Of Liquids 6. Methods of Analysis 6.1 Titrimetric Analysis 6 . 2 Colorimetric Analysis 6.4 Turbidimetric Analysis 6.7 Polarographic Analysis 6.8 Miscellaneous References
ANALYTICAL PROFILES OF DRUG SUBSTANCES VOLUME 12
713
714 7 14 714 714 717 718 718 718 718 718 719 719 719
Copyright by the American Pharmaceutlaal Asswiatmn ISBN 0-12-260812-7
SATINDER AHUJA AND JEROLD COHEN
714
The following supplement contains updated information pertaining to the analytical chemistry of dioctyl sodium sulfosuccinate. A literature survey was conducted and is complete up to June, 1982. The numbering system for topics discussed is the same as that in the original profile (Volume 2, pp.199-219). 1.
DESCRIPTION
1.1 Name, Formula, Molecular Weight, Elemental Composition Dioctyl sodium sulfosuccinate is known as docusate sodium (1). It is also known as sulfobutanedioic acid 1 , 4 bis(2-ethylhexyl) ester sodium salt, sulfosuccinic acid 1 , 4 bis(2-ethylhexyl) ester S-sodium salt, Comfolax, Molcer, Soliwax and Valsol OT ( 2 ) . It has a molecular weight of 444.56 (C20H37NaO7S).
C2Il5 I COOCH2CH(CH2) 3CH3
I
CH2 I CH-SO3Na
I
COOCH2CH(CH2) 3CH3 I C2H5
2.
PHYSICAL PROPERTIES
2.3
Mass Spectrometry A chemical ionization mass spectrum (Kratos MS 25 with isobutane as reagent gas) was run on the acid form of dioctyl sodium sulfosuccinate prepared by acidification of a methanolic solution with HC1 gas ( 3 ) . The interpretation of major fragmentation ions (Figure 1) is as follows ( 4 ) :
DIOCTYL SODIUM SULFOSUCCINATE
157
715
113
- r H @ ‘ 0
m/z 4 2 3
HO-!
1~
0:
It0
CH3 2
~
L99
229 129
t
5
1-
I
S02H
l@
‘ZH5
O/\I/\/\CH3
m/z 358
3-0
HO
0
‘ZH5
c.
1
211
H
-OH
-
‘ZH5 3
/\J/\/\CH
O
8
0
W
‘ZH5
‘
H
3
m/z 341
716
SATINDER AHUJA AND JEROLD COHEN
100
-
w m -
m 0 0 -
w -
4 0 -
5 0 -
I
Figure 1.
Chemical Ionization Mass Spectrum of the Acid Form of Dioctyl Sodium Sulfosuccinate. (Drawn to show major fragments)
DIOCTYL SODIUM SULFOSUCCINATE
717
2.8
Solubilization The critical micelle concentration value of 3.0 nmoles/l was determined by plotting desorption potential (d.c. polarography without electrolyte) vs. log concentration (5). The solution states of dioctyl sodium sulfosuccinate were examined by lH NMR (6). Two hydrocarbon chains of its molecules, in the monomeric state, aggregate with each other in water. Addition of aqueous sodium chloride solution to the Aerosol OT-n-octane system showed a peak corresponding to micellarsolubilized water and another peak corresponding to separated water (7). Systems containing aluminum chloride differed from those containing mono or divalent electrolytes. In 0.27M AlC13, the two peaks merged into a single peak, indicating breakdown of the micellar system. The magnitude of cation effect was in the order Na