![Highway Assignment Week 9 [PDF]](https://pdfs.asia/img/200x200/highway-assignment-week-9.jpg)
16 0 90 KB
Highway Engineering Assignment Week 9 Farell / 2201733585 / LB43 QUESTION
Given data: a.
g1
= -3%;
b.
g2
= +4%;
c.
PVI Station
= 5 + 000;
d.
Elevation at PVI
= 500 m;
c.
Vertical curve length (L)
= 275 m.
ANSWER a.
PVC Station
= PVI Station – L/2 = STA 5 + 000 – 275/2 = STA 4 + 862.5;
b.
PVT Station
= PVI Station + L/2 = STA 5 + 000 + 275/2 = STA 5 + 137.5;
c.
Elevation at PVC
= Elevation at PVI - g1(L/2) = 500 – (-0.03)(275/2) = 503.125 m;
d.
Elevation at PVT
= Elevation at PVI + g2(L/2) = 500 + (0.04)(275/2)
`
= 505.5 m;
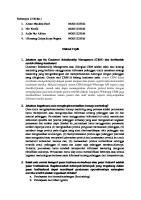
After obtaining the elevation and station at PVC, stations and elevations every 50 m after PVC until PVT can be determined. The calculation results can be seen in the following table: Station
x (m)
STA 4 + 862.5 STA 4 + 912.5 STA 4 + 962.5 STA 5 + 012.5 STA 5 + 062.5 STA 5 + 112.5 STA 5 + 137.5
0 50 100 150 200 250 275
Tangent Elevation (m) 504.13 502.63 501.13 499.63 498.13 496.63 495.88
y (m)
Curve Elevation (m)
0.00 0.32 1.27 2.86 5.09 7.95 9.63
504.13 502.95 502.40 502.49 503.22 504.58 505.51
The calculation sample for the preceding table are as follows: a.
Tangent Elevation
= Elevation at PVC + g1x = 504.13 + (-0.03)(50) = 502.63 m;
b.
y
( g 2 - g1 ) x2 = 2L =
( 0.04 - (-0.03 ) ( 50 )2 2(275)
= 0.32; c.
Curve elevation
= Tangent Elevation + y = 502.63 – 0.32 = 502.95 m.
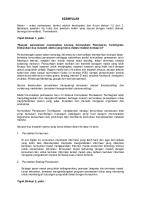
A graph can be drawn to provide a clearer illustration on the elevation data. The graph is shown below:
12 10 Elevation (m)
8 6
PVT
PVC
4 2 0 Elevation on initial tangent (m)
Final Elevation on curve (m)
Elevation Detail Graph Since the PVT Station is determined, station 20 m after PVT can be determined as follows: a.
20 m after PVT Station
= PVT Station + 20 m = STA 5 +137.5 +20 = STA 5+ 157.5;
b.
Elevation at 20 m after PVT = Elevation at PVT + g2 (20) = 505.5 + (0.04)(20) = 506.3 m. REFERENCES
Garber, N. J. & Hoel, L. A. (2015). Traffic and Highway Engineering (5th ed.). Stamford, USA: Cengage Learning.