![Indonesia Freight Transport & Shipping Report 2021 [PDF]](https://pdfs.asia/img/200x200/indonesia-freight-transport-amp-shipping-report-2021.jpg)
14 0 2 MB
Q2 2021 www.fitchsolutions.com
Indonesia Fr Freight eight T Trransport & Shipping Report Includes 5-year forecasts to 2025
EMISPDF in-beroe04 from 137.97.88.22 on 2021-07-20 11:15:35 BST. DownloadPDF. Downloaded by in-beroe04 from 137.97.88.22 at 2021-07-20 11:15:35 BST. EMIS. Unauthorized Distribution Prohibited.
EMISPDF in-beroe04 from 137.97.88.22 on 2021-07-20 11:15:35 BST. DownloadPDF. Downloaded by in-beroe04 from 137.97.88.22 at 2021-07-20 11:15:35 BST. EMIS. Unauthorized Distribution Prohibited.
Indonesia Freight Transport & Shipping Report | Q2 2021
Contents Key View............................................................................................................................................................................................ 4 SWOT .................................................................................................................................................................................................. 6 Freight Transport & Shipping SWOT...................................................................................................................................................................................... 6
Industry Forecast........................................................................................................................................................................... 7 Trade Forecast................................................................................................................................................................................................................................ 7 Road Freight Forecast...............................................................................................................................................................................................................12 Rail Freight Forecast ..................................................................................................................................................................................................................15 Air Freight Forecast....................................................................................................................................................................................................................18 Shipping Forecast.......................................................................................................................................................................................................................21
Market Overview..........................................................................................................................................................................25 Company Profile...........................................................................................................................................................................29 Garuda Indonesia Cargo .........................................................................................................................................................................................................29
Indonesia Demographic Outlook............................................................................................................................................31 Freight Transport & Shipping Methodology........................................................................................................................34
© 20 2021 21 Fit Fitch ch Solutions Gr Group oup Limit Limited. ed. All rights rreserv eserved. ed.
All information, analysis, forecasts and data provided by Fitch Solutions Group Limited is for the exclusive use of subscribing persons or organisations (including those using the service on a trial basis). All such content is copyrighted in the name of Fitch Solutions Group Limited and as such no part of this content may be reproduced, repackaged, copied or redistributed without the express consent of Fitch Solutions Group Limited.
All content, including forecasts, analysis and opinion, has been based on information and sources believed to be accurate and reliable at the time of publishing. Fitch Solutions Group Limited makes no representation of warranty of any kind as to the accuracy or completeness of any information provided, and accepts no liability whatsoever for any loss or damage resulting from opinion, errors, inaccuracies or omissions affecting any part of the content.
This report from Fitch Solutions Country Risk & Industry Research is a product of Fitch Solutions Group Ltd, UK Company registration number 08789939 (‘FSG’). FSG is an affiliate of Fitch Ratings Inc. (‘Fitch Ratings’). FSG is solely responsible for the content of this report, without any input from Fitch Ratings. Copyright © 2021 Fitch Solutions Group Limited. THIS COMMENTARY IS PUBLISHED BY FITCH SOLUTIONS COUNTRY RISK & INDUSTRY RESEARCH and is NOT a comment on Fitch Ratings' Credit Ratings. Any comments or data included in the report are solely derived from Fitch Solutions Country Risk & Industry Research and independent sources. Fitch Ratings analysts do not share data or information with Fitch Solutions Country Risk & Industry Research.
EMISPDF in-beroe04 from 137.97.88.22 on 2021-07-20 11:15:35 BST. DownloadPDF. fitchsolutions.com Downloaded by in-beroe04 from 137.97.88.22 at 2021-07-20 11:15:35 BST. EMIS. Unauthorized Distribution Prohibited.
3
Indonesia Freight Transport & Shipping Report | Q2 2021
Key View Key View: We expect all freight sub-sectors to experience a significant pickup in the short term thanks to a resumption in economic activity across various industries. We believe that the risks to our growth outlook are balanced, although risks remain dependent on the pandemic's development. If a vaccine is made available to emerging markets sooner than Q2 2021, then upside risks will emerge in our growth forecast. However, if the vaccine development faces severe delays and nations across the world are required to impose strict lockdowns once again, then severe downside risks will emerge in our short-term (2021) forecast. Freight transport is heavily reliant on roads and we expect this to remain so over the medium-to-long term. The Covid-19 pandemic has seen a pick-up in cross-border road freight, as shippers look to avoid volatile air and ocean freight markets. While road freight was previously used only for shorter routes, it is now also used over longer distances.
Key Updates & Forecasts • Our Infrastructure team highlights that growth in Indonesia's transport infrastructure sector will outperform the country's wider infrastructure sector as the substantial pipeline of road, rail, port and airport projects gradually come online. Alleviating logistical bottlenecks in the country, by channelling both public and private investment to the transport sector, will remain a government priority over the coming decade. • We expect all freight modes, including the shipping sub-sector, to benefit from a one-off above-trend uptick in 2021, driven by the unlocking of pent-up demand in Indonesia and abroad. • On December 30 2020, the Indonesian government announced that LG Energy Solution, the new battery production unit of LG Group that spun out of LG Chem in December 2020, signed a memorandum of understanding on a USD9.8bn deal to make electric car batteries in the country. According to reports, this move has resulted in high interest to invest in battery production in Indonesia, with companies like Tesla currently evaluating a potential investment. • On December 18 2020, South Korea and Indonesia signed an economic partnership agreement aimed at boosting investment and trade between the two countries, in areas ranging from automobiles to apparel. Under the agreement, South Korea will eliminate more than 95% of its tariff lines and Indonesia eliminate over 92% and give preferential tariffs to support Korean investment. • The ASEAN Customs Transit System is set to boost multimodal connectivity within the region. In December 2020, the ASEAN Ministry of Transport approved up to 500 trucks for cross-border permits, allowing goods to be transported across borders on the same truck from departure to destination point, thus eliminating the need to transfer goods to a local truck at a border. • The China Plus One sourcing strategy also provides upside risk to our forecast, as it will continue to facilitate increased road and multimodal volumes across the region. Although this is especially nuanced in the key markets connected by an established road network, it will increasingly extend further to Indonesia. • In December 2020, railway developer PT Kereta Cepat Indonesia China (KCIC) announced that it had completed 63.9% of construction on the Jakarta-Bandung high-speed rail (HSR), overcoming delays due to the Covid-19 pandemic. On December 15, it was announced that the tunnel drilling for South East Asia's first HSR project had reached 74.94% completion. Due to a combination of challenges in 2020, KCIC has pushed back its completion and operation target to H221 from the initial target of June 2021. • On December 20, Indonesia's President Joko Widodo inaugurated the new port of Patimban, one of the largest seaports in the country. The USD3bn facility in West Java was partially funded with USD1.2bn in backing from the Japanese government. At least 10 different automakers (among which include several Japanese brands) have plants located near the seaport, and the development will help to lower their shipping costs.
THIS COMMENTARY IS PUBLISHED BY FITCH SOLUTIONS COUNTRY RISK & INDUSTRY RESEARCH and is NOT a comment on Fitch Ratings' Credit Ratings. Any comments or data included in the report are solely derived from Fitch Solutions Country Risk & Industry Research and independent sources. Fitch Ratings analysts do not share data or information with Fitch Solutions Country Risk & Industry Research.
EMISPDF in-beroe04 from 137.97.88.22 on 2021-07-20 11:15:35 BST. DownloadPDF. fitchsolutions.com Downloaded by in-beroe04 from 137.97.88.22 at 2021-07-20 11:15:35 BST. EMIS. Unauthorized Distribution Prohibited.
4
Indonesia Freight Transport & Shipping Report | Q2 2021
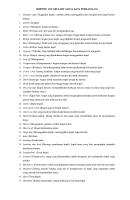
Road Recovery Aligns With Economy Indonesia - Road Freight & GDP Growth (2019-2025)
e/f = Fitch Solutions estimate/forecast. Source: National sources, Fitch Solutions
THIS COMMENTARY IS PUBLISHED BY FITCH SOLUTIONS COUNTRY RISK & INDUSTRY RESEARCH and is NOT a comment on Fitch Ratings' Credit Ratings. Any comments or data included in the report are solely derived from Fitch Solutions Country Risk & Industry Research and independent sources. Fitch Ratings analysts do not share data or information with Fitch Solutions Country Risk & Industry Research.
EMISPDF in-beroe04 from 137.97.88.22 on 2021-07-20 11:15:35 BST. DownloadPDF. fitchsolutions.com Downloaded by in-beroe04 from 137.97.88.22 at 2021-07-20 11:15:35 BST. EMIS. Unauthorized Distribution Prohibited.
5
Indonesia Freight Transport & Shipping Report | Q2 2021
SWOT Freight Transport & Shipping SWOT SWOT Analysis Strengths
• Large population, located near one of the world's most important maritime trade routes and plentiful natural resources. • Domestic demand will continue to drive growth in the freight industry, with the logistics industry forecast to see the benefits of this. • Indonesia's strategic location between the Indian and Pacific Oceans and its adjacency to major east-west trade routes make it an important economy in the region.
Weaknesses
• The transport and logistics situation is poor, especially in rural regions and smaller islands, posing bottlenecks to companies operating in the country. • The country has been exposed to a range of natural disasters, including earthquakes and tsunamis, which have inflicted damage on transport infrastructure. • The mining sector is showing little sign of picking up despite the easing of the mineral export ban, and the manufacturing and retail and wholesale sectors appear to be on a slight downturn.
Opportunities
• The US-China trade war could lead the US to leverage its alliances to form a coalition to counter unfair Chinese economic practices and cement its economic interests in the Asia Pacific region. • Although overall coal output is stagnating, the development of new coal mines in various parts of the country has boosted demand for rail freight. • The variety of trade agreements currently being pursued by Indonesia should help bolster the trade outlook going forward. • The aviation sector is set to benefit from rising living standards, with a greater proportion of the population able to afford air travel. • Economic integration of South East Asia in the form of the Association of Southeast Asian Nations Economic Community could provide an opportunity for the freight industry by opening up markets and encouraging investment in infrastructure. • New maritime axis doctrine will generate projects and opportunities in the ports sector.
Threats
• New air cargo and supply chain safety regulation requiring additional layers of cargo inspections could reduce the competitiveness of Indonesia's air freight industry. • Aviation sector could face a severe, protracted downtrend over the coming years. • Congestion in key urban centres, such as Jakarta, and in ports, such as Tanjung Priok, can lead to expensive delays and supply bottlenecks. • A prolonged escalation of the US-China trade war would weigh on investment sentiment in Indonesia.
THIS COMMENTARY IS PUBLISHED BY FITCH SOLUTIONS COUNTRY RISK & INDUSTRY RESEARCH and is NOT a comment on Fitch Ratings' Credit Ratings. Any comments or data included in the report are solely derived from Fitch Solutions Country Risk & Industry Research and independent sources. Fitch Ratings analysts do not share data or information with Fitch Solutions Country Risk & Industry Research.
EMISPDF in-beroe04 from 137.97.88.22 on 2021-07-20 11:15:35 BST. DownloadPDF. fitchsolutions.com Downloaded by in-beroe04 from 137.97.88.22 at 2021-07-20 11:15:35 BST. EMIS. Unauthorized Distribution Prohibited.
6
Indonesia Freight Transport & Shipping Report | Q2 2021
Industry Forecast Trade Forecast Key View: After two years of negative growth, we expect trade to enter positive growth trajectory over the short-to-medium term. The global Covid-19 pandemic sharply reduced volumes of both imports and exports in 2020, but we expect trade volumes to rebound in the short term and to grow steadily as trade conditions improve. We believe that the risks to our growth outlook are balanced, although this remains dependent on the pandemic's development. If a vaccine is made available to emerging markets sooner than Q2 2021, then upside risks will emerge in our growth forecast. However, if the vaccine development faces severe delays and nations across the world are required to impose strict lockdowns once again, then severe downside risks will emerge in our short-term (2021) forecast. Latest Updates • On January 4 2021, Canada Pension Plan Investment Board (CPP Investments) and logistics real estate specialist LOGOS announced the establishment of a new Indonesian venture for the development of modern logistics facilities in Greater Jakarta. CPP Investments will invest USD200mn into the joint venture, which will develop a diversified portfolio of facilities targeted at third-party logistics, data centre and industrial tenants. • On December 30 2020, the Indonesian government announced that LG Energy Solution, the new battery production unit of LG Group that spun out of LG Chem in December 2020, signed a memorandum of understanding (MoU) on a USD9.8bn deal to make electric car batteries in the country. According to reports, this move has resulted in high interest to invest in battery production in Indonesia, with companies like Tesla currently evaluating a potential investment. • On December 28 2020, Qatar's telecoms company Ooredoo and Hong Kong conglomerate CK Hutchison Holdings announced that they are exploring a deal to merge their Indonesian units. Ooredoo, which owns a 65% stake in Indosat, announced that the two companies have signed a non-legally binding MoU, which is valid until April 30 2021. • On December 18 2020, South Korea and Indonesia signed an economic partnership agreement aimed at boosting investment and trade between the two countries, in areas ranging from automobiles to apparel. Under the agreement, South Korea will eliminate more than 95% of its tariff lines and Indonesia eliminate over 92% and give preferential tariffs to support Korean investment. South Korea's Hyundai Motor Group and LG Chem are among the South Korean companies reportedly considering investments in battery cell manufacturing in Indonesia. • The relocation of Indonesia’s capital city from Jakarta to East Kalimantan on the Borneo Island will open up huge potential opportunities for businesses, particularly those in the infrastructure, banking and financial services sectors. Jakarta, Indonesia’s current capital city, is sinking rapidly at an average of 4cm per year, and is prone to natural hazards such as flooding, in addition to having poor air quality due to congestion. The new capital city is expected to require an investment of USD33bn and will involve relocating headquarters of government departments and ministries together with foreign missions. The government plans to accomplish this in phases commencing in 2024 and anticipates it will become home to roughly 6mn to 7mn people. President Joko Widodo's administration is counting on private and state-owned entities to bear about 80% of the cost of building the capital, opening up investment opportunities for construction firms, financiers and related businesses. • Indonesia and China have agreed to work on and promote a framework of direct settlement between the rupiah and yuan, marking a significant milestone for the two countries' trade and investment transactions. On September 30 2020, Perry Warjiyo, the governor of Bank Indonesia, and his Chinese counterpart Yi Gang, the governor of The People's Bank of China, signed an MoU for the framework. According to the central bank, under the agreement, Bank Indonesia and The People's Bank of China would work to promote 'the use of local currencies for trade and direct investment settlement', which includes, among others, promotion of the direct exchange rate quotation and interbank trading between the Chinese yuan and the Indonesian rupiah. • The Indonesian-Australia Comprehensive Economic Partnership Agreement came into operation from July 5 2020. Under the deal, Indonesian goods will enter Australia tariff free, while tariffs on 94% of Australian goods exported to Indonesia will be gradually eliminated. Increased trade between the two states boosts trade opportunities for businesses and will expand supply chains, which will increase and diversify revenue streams going forward.
THIS COMMENTARY IS PUBLISHED BY FITCH SOLUTIONS COUNTRY RISK & INDUSTRY RESEARCH and is NOT a comment on Fitch Ratings' Credit Ratings. Any comments or data included in the report are solely derived from Fitch Solutions Country Risk & Industry Research and independent sources. Fitch Ratings analysts do not share data or information with Fitch Solutions Country Risk & Industry Research.
EMISPDF in-beroe04 from 137.97.88.22 on 2021-07-20 11:15:35 BST. DownloadPDF. fitchsolutions.com Downloaded by in-beroe04 from 137.97.88.22 at 2021-07-20 11:15:35 BST. EMIS. Unauthorized Distribution Prohibited.
7
Indonesia Freight Transport & Shipping Report | Q2 2021
Short Term We expect trade volumes to return to positive growth of 5.6% y-o-y in 2021, following two years of sharp contractions of 4.2% and 11.1% y-o-y in 2019 and 2020 respectively. The global Covid-19 pandemic sharply reduced volumes of both imports and exports in 2020, both due to weak external demand and domestic economic disruption. We forecast a recovery in both domestic and international economic activity to drive real growth of 6.0% and 5.0% in exports and imports respectively. We at Fitch Solutions expect a 6.1% economic recovery in 2021, from 3.3% forecasted previously. Indonesia’s economy contracted by 3.5% y-o-y in Q320, plunging it into a technical recession for the first time since the Asian financial crisis of the 1990s. We expect the central bank of Indonesia, Bank Indonesia (BI) to keep the benchmark seven-day reverse repurchase rate unchanged at 3.75% over the forthcoming months. We believe that BI will slow the pace of easing in 2021, although further cuts of up to 50bps to 3.25% next year is still likely. We expect consumer price inflation to remain within the BI’s target range of 2-4% through 2021 and room for dovish monetary policy will remain. We expect the Indonesian rupiah will continue to be closely managed by the BI over the short term, but some tailwind is likely to also emerge with the availability of a Covid-19 vaccine globally and in Indonesia. Continued quantitative easing undertaken by BI could raise inflationary risks over the long term, whichcould accord downside pressures on the Indonesian rupiah. We believe that the risks to our growth outlook are balanced, although risks remain dependent on the pandemic's development. If a vaccine is made available to emerging markets sooner than the second half of 2021, then upside risks will emerge to our growth forecast. In contrast, if the vaccine development faces severe delays and nations across the world are required to impose strict lockdowns once again, then severe downside risks will emerge to our 2021 forecast.
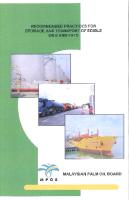
Trade To Return To Positive Growth Over Short-To-Medium Term Indonesia - Imports & Exports Value (2019-2025)
e/f = Fitch Solutions estimate/forecast. Source: IMF, Fitch Solutions
Medium Term We expect trade volumes to remain steady over the medium term, with domestic and international economic activity driving real growth of 6.0% and 5.0% in exports and imports respectively. We forecast trade growth to average 5.5% over 2021-2025. This would take the nominal value of total trade to USD603.2bn in 2025 compared to USD436.7bn in 2021.
THIS COMMENTARY IS PUBLISHED BY FITCH SOLUTIONS COUNTRY RISK & INDUSTRY RESEARCH and is NOT a comment on Fitch Ratings' Credit Ratings. Any comments or data included in the report are solely derived from Fitch Solutions Country Risk & Industry Research and independent sources. Fitch Ratings analysts do not share data or information with Fitch Solutions Country Risk & Industry Research.
EMISPDF in-beroe04 from 137.97.88.22 on 2021-07-20 11:15:35 BST. DownloadPDF. fitchsolutions.com Downloaded by in-beroe04 from 137.97.88.22 at 2021-07-20 11:15:35 BST. EMIS. Unauthorized Distribution Prohibited.
8
Indonesia Freight Transport & Shipping Report | Q2 2021
Over the medium term, we believe that new government measures aimed at improving the current account, including new tax allowances for export-oriented companies, will deliver a much-needed boost to the trade landscape. Growing wages and rising disposable incomes will bolster consumption and naturally lead to an improved import outlook. The government aims to encourage development of the manufacturing export sector in order to rebalance the economy away from reliance on commodity exports. While there is already strong growth in the export of automobiles and electrical machinery, continued expansion will face stiff competition from other emerging manufacturing hubs including Vietnam, India and Bangladesh. Long Term Looking beyond 2025, we are optimistic regarding Indonesia's trade and economic growth outlook. Import growth will be boosted by a strong domestic demand story. We expect private consumption to remain robust, averaging 2.7% real growth out to 2030. We believe that the increasing wealth of Indonesians (GDP per capita in US dollar terms is projected to almost double from 2019 to 2029) will translate into higher spending power and continue to fuel household spending. Moreover, Indonesia's young and growing population suggest that private consumption growth can be sustained for an extended period. Exports will become less dominated by coal over the coming decade for two reasons. First, foreign demand growth for Indonesia's thermal coal will slow, particularly from China. Second, a large pipeline of domestic coal-fired power plants will be constructed in Indonesia over the coming decade, which will significantly boost domestic demand for coal and leave less available for export. The expansion of Indonesia’s infrastructure sector will support trade growth across all freight modes over the long term, driven primarily by high-value road and rail projects across the archipelago. In May, President Joko Widodo issued a new regulation that expands the types of land that can be unilaterally acquired by the state for purposes deemed to be in the public interest. Limited under a 2016 regulation to land held by state-owned companies, areas that may be subject to eminent domain under the new presidential regulation now include forests, villages and land bequeathed for religious and charitable use. The regulation is just one in a series of steps the government is taking to ramp-up major infrastructure projects billed as key to jump-starting the economy out of the current pandemic-induced slowdown. On the government’s docket are 89 projects, most of them newly proposed and the rest expansions of existing projects. They include roads and railways, ports and airports, dams and power plants, industrial estates and plantations. The common hurdle, says Widodo, is land acquisition. Among the 89 priority projects is a Chinese-backed high-speed railway line that will connect Jakarta to the West Java capital Bandung, part of China’s Belt and Road Initiative. Although well behind schedule because of delays in acquiring land, the project is being considered for expansion all the way to the East Java capital, Surabaya. There’s also road projects planned across Kalimantan. The government is banking on these projects to be eased through by a deregulation bill that’s currently in parliament, and which it expects will pass in July. The bill contains more than 1,000 proposed amendments to at least 79 existing laws that, among other points, prescribe lighter penalties for environmental violations; scrap a requirement for environmental impact assessments; vastly deregulate the mining industry; and make it easier to rezone coastal areas for development. The bill also calls for the creation of a new government institution, the Land Management Agency, to acquire, manage and distribute land not claimed by citizens and that, by default, falls under state control. The bill says the agency will function as a 'land bank' and must guarantee the availability of land for both social and development interests. TRADE OVERVIEW (INDONESIA 2019-2025) Indicator
2019
2020e
2021f
2022f
2023f
2024f
2025f
Imports, real growth, % y-o-y
-7.69
-16.20
5.00
6.50
6.50
6.50
6.50
Exports, real growth, % y-o-y
-0.87
-6.50
6.00
4.50
4.50
4.50
4.50
Total Trade, real growth, % y-o-y
-4.23
-11.11
5.55
5.39
5.40
5.41
5.42
213.45
176.47
208.22
232.71
238.19
260.69
299.01
-5.34
-17.32
17.99
11.76
2.35
9.45
14.70
Imports, USDbn Import growth, % y-o-y
THIS COMMENTARY IS PUBLISHED BY FITCH SOLUTIONS COUNTRY RISK & INDUSTRY RESEARCH and is NOT a comment on Fitch Ratings' Credit Ratings. Any comments or data included in the report are solely derived from Fitch Solutions Country Risk & Industry Research and independent sources. Fitch Ratings analysts do not share data or information with Fitch Solutions Country Risk & Industry Research.
EMISPDF in-beroe04 from 137.97.88.22 on 2021-07-20 11:15:35 BST. DownloadPDF. fitchsolutions.com Downloaded by in-beroe04 from 137.97.88.22 at 2021-07-20 11:15:35 BST. EMIS. Unauthorized Distribution Prohibited.
9
Indonesia Freight Transport & Shipping Report | Q2 2021
Indicator Exports, USDbn Export growth, % y-o-y Total trade, USDbn Total trade growth, % y-o-y
2019
2020e
2021f
2022f
2023f
2024f
2025f
207.93
191.81
228.47
250.55
251.63
270.23
304.14
-3.14
-7.75
19.12
9.66
0.43
7.39
12.55
421.37
368.27
436.69
483.26
489.82
530.91
603.15
-4.26
-12.60
18.58
10.66
1.36
8.39
13.61
e/f = Fitch Solutions estimate/forecast. Source: National sources, Fitch Solutions
KEY TRADE INDICATORS (INDONESIA 2019-2025) Indicator
2019e
2020e
2021f
2022f
2023f
2024f
2025f
Agricultural raw materials, imports, USDmn
5,048
4,290
4,941
5,443
5,555
6,017
6,802
Agricultural raw materials, imports, % y-o-y
-4.7
-15.0
15.2
10.2
2.1
8.3
13.1
Agricultural raw materials, exports, USDmn
8,780
7,822
10,001
11,313
11,377
12,482
14,496
Agricultural raw materials, exports, % y-o-y
-4.4
-10.9
27.8
13.1
0.6
9.7
16.1
Ores and metals, exports, USDmn
12,065
11,301
13,039
14,086
14,137
15,019
16,626
Ores and metals, exports, % y-o-y
-2.6
-6.3
15.4
8.0
0.4
6.2
10.7
Ores and metals, imports, USDmn
6,267
5,274
6,126
6,784
6,931
7,535
8,564
Ores and metals, imports, % y-o-y
-4.9
-15.8
16.2
10.7
2.2
8.7
13.7
Iron and steel, exports, USDmn
6,291
6,107
6,527
6,780
6,792
7,005
7,394
Iron and steel, exports, % y-o-y
-1.2
-2.9
6.9
3.9
0.2
3.1
5.5
Iron and steel, imports, USDmn
9,681
8,002
9,443
10,555
10,804
11,825
13,564
Iron and steel, imports, % y-o-y
-5.3
-17.3
18.0
11.8
2.4
9.5
14.7
Manufactured goods, exports, USDmn
75,784
71,289
81,511
87,665
87,966
93,150
102,603
Manufactured goods, exports, % y-o-y
-2.4
-5.9
14.3
7.5
0.3
5.9
10.1
Manufactured goods, imports, USDmn
115,099
93,945
112,110
126,119
129,253
142,124
164,049
Manufactured goods, imports, % y-o-y
-5.6
-18.4
19.3
12.5
2.5
10.0
15.4
Fuels, exports, USDmn
40,101
35,532
45,921
52,176
52,482
57,751
67,358
Fuels, exports, % y-o-y
-4.5
-11.4
29.2
13.6
0.6
10.0
16.6
Fuels, imports, USDmn
30,530
24,296
29,649
33,777
34,701
38,494
44,954
Fuels, imports, % y-o-y
-6.2
-20.4
22.0
13.9
2.7
10.9
16.8
e/f = Fitch Solutions estimate/forecast. Source: UNCTAD, Fitch Solutions
THIS COMMENTARY IS PUBLISHED BY FITCH SOLUTIONS COUNTRY RISK & INDUSTRY RESEARCH and is NOT a comment on Fitch Ratings' Credit Ratings. Any comments or data included in the report are solely derived from Fitch Solutions Country Risk & Industry Research and independent sources. Fitch Ratings analysts do not share data or information with Fitch Solutions Country Risk & Industry Research.
EMISPDF in-beroe04 from 137.97.88.22 on 2021-07-20 11:15:35 BST. DownloadPDF. fitchsolutions.com Downloaded by in-beroe04 from 137.97.88.22 at 2021-07-20 11:15:35 BST. EMIS. Unauthorized Distribution Prohibited.
10
Indonesia Freight Transport & Shipping Report | Q2 2021
MAIN EXPORT PARTNERS (INDONESIA 2013-2019)
China, USDmn China, USDmn, % of total US, USDmn US, USDmn, % of total Japan, USDmn Japan, USDmn, % of total Singapore, USDmn Singapore, USDmn, % of total India, USDmn India, USDmn, % of total Total, USDmn
2013
2014
2015
2016
2017
2018
2019
22,601.5
17,606.2
15,044.7
16,790.8
23,049.3
27,121.3
27,191.8
12.4
10.0
10.0
12.3
13.7
15.6
16.5
15,741.1
16,560.1
16,266.9
16,172.0
17,810.5
18,462.3
17,319.8
8.6
9.4
10.8
11.8
10.6
10.6
10.5
27,086.3
23,165.7
18,014.3
16,098.6
17,790.8
19,472.6
15,597.8
14.8
13.1
12.0
11.8
10.5
11.2
9.5
16,686.3
16,806.9
12,649.9
11,861.0
12,767.8
12,984.6
13,212.9
9.1
9.5
8.4
8.7
7.6
7.5
8.0
13,031.3
12,249.0
11,713.0
10,103.9
14,083.6
13,725.5
11,245.0
7.1
6.9
7.8
7.4
8.4
7.9
6.8
182,551.8 176,292.5 150,393.2 136,845.6 168,663.2 174,052.6 164,615.7
Total, top five trade partners, USDmn % from top five trade partners
95,146.5
86,387.8
73,688.8
71,026.3
85,501.9
91,766.3
84,567.4
52.1
49.0
49.0
51.9
50.7
52.7
51.4
Note: Total exports is from Direction of Trade Statistics, consequently there may be some discrepancy with data used elsewhere in this report. Source: IMF
MAIN IMPORT PARTNERS (INDONESIA 2013-2019)
China, USDmn China, USDmn, % of total Japan, USDmn Japan, USDmn, % of total US, USDmn US, USDmn, % of total Thailand, USDmn Thailand, USDmn, % of total Malaysia, USDmn Malaysia, USDmn, % of total Total, USDmn
2013
2014
2015
2016
2017
2018
2019
29,849.5
30,624.3
29,410.9
30,800.5
35,767.2
45,537.8
46,660.3
16.0
17.2
20.6
22.7
22.8
23.7
31.3
19,284.6
17,007.6
13,263.5
12,984.8
15,241.4
17,976.7
14,758.0
10.3
9.5
9.3
9.6
9.7
9.4
9.9
9,081.8
8,188.5
7,616.8
7,319.2
8,150.2
10,212.4
8,720.8
4.9
4.6
5.3
5.4
5.2
5.3
5.9
10,703.1
9,781.0
8,083.4
8,666.9
9,279.5
10,952.8
8,459.9
5.7
5.5
5.7
6.4
5.9
5.7
5.7
13,322.5
10,855.4
8,530.7
7,200.9
8,796.7
8,602.8
7,057.4
7.1
6.1
6.0
5.3
5.6
4.5
4.7
186,628.7 178,178.6 142,694.3 135,540.0 156,600.6 192,255.5 148,987.7
Total, top five trade partners, USDmn % from top five trade partners
82,241.5
76,456.9
66,905.2
66,972.3
77,235.1
93,282.6
85,656.5
44.1
42.9
46.9
49.4
49.3
48.5
57.5
Note: Total imports is from Direction of Trade Statistics, consequently there may be some discrepancy with data used elsewhere in this report. Source: IMF
THIS COMMENTARY IS PUBLISHED BY FITCH SOLUTIONS COUNTRY RISK & INDUSTRY RESEARCH and is NOT a comment on Fitch Ratings' Credit Ratings. Any comments or data included in the report are solely derived from Fitch Solutions Country Risk & Industry Research and independent sources. Fitch Ratings analysts do not share data or information with Fitch Solutions Country Risk & Industry Research.
EMISPDF in-beroe04 from 137.97.88.22 on 2021-07-20 11:15:35 BST. DownloadPDF. fitchsolutions.com Downloaded by in-beroe04 from 137.97.88.22 at 2021-07-20 11:15:35 BST. EMIS. Unauthorized Distribution Prohibited.
11
Indonesia Freight Transport & Shipping Report | Q2 2021
Road Freight Forecast Key View: We expect road freight volumes to rebound in the short term (2021), thanks to a resumption in economic activity across various industries, particularly the construction sector. The shift to e-commerce platforms in 2020 is likely to have a permanent, positive impact on e-commerce volumes. The Covid-19 pandemic has seen a pick-up in cross-border road freight, as shippers look to avoid volatile air and ocean freight markets. While road freight was previously only used for shorter routes, it is now also used over longer distances. Over the long term, investment and construction activity within the roads infrastructure sector will be sustained as Indonesia's vehicles fleet and road traffic levels continue to grow in line with its economic development. Latest Updates • Road freight volumes will rebound in the short term (2021). A resumption in economic activity across various industries will result in strong road freight demand, particularly from the construction sector. • Total volumes will be supported by a lasting surge in e-commerce activity from 2021 onwards. • There has been a pick-up in cross-border road freight, as shippers look to avoid volatile air and ocean freight markets amid the Covid-19 pandemic. Road freight is using longer distances alongside its use of short routes. • The ASEAN Customs Transit System is set to boost multimodal connectivity within the region. In December 2020, the ASEAN Ministry of Transport approved up to 500 trucks for cross-border permits, allowing goods to be transported across borders on the same truck from departure to destination point, thus eliminating the need to transfer goods to a local truck at a border. • The China Plus One sourcing strategy also provides upside risk to our forecast, as it will continue to facilitate increased road and multimodal volumes across the region. Although this is especially nuanced in the key markets connected by an established road network, it will increasingly extend further to Indonesia. Short Term We forecast road freight volumes to rebound in the short term (2021). We expect road freight will be supported by continued, albeit slower, growth in household expenditures over 2021 and 2022. We forecast road freight to grow by 2.0% in the short term (2021), strengthening from a 10.4% contraction in 2020. In 2021, total road freight volumes will reach 1.4bn tonnes. A resumption in economic activity across various industries will result in strong road freight demand, particularly from the construction sector. Moreover, the 2020 shift to e-commerce platforms is likely to have a permanent positive impact on ecommerce volumes. Looking back, E-commerce was a bright spot for road freight for much of 2020, as both households and businesses shifted their economic activity to digital platforms. We expect that the shift to e-commerce platforms in 2020 is likely to have a permanent positive impact on e-commerce volumes from 2021 onwards. The China Plus One sourcing strategy also provides upside risk to our forecast, as it will continue to facilitate increased road and multimodal volumes across the region. Although this is especially nuanced in the key markets connected by an established road network, it will increasingly extend further to Indonesia.
THIS COMMENTARY IS PUBLISHED BY FITCH SOLUTIONS COUNTRY RISK & INDUSTRY RESEARCH and is NOT a comment on Fitch Ratings' Credit Ratings. Any comments or data included in the report are solely derived from Fitch Solutions Country Risk & Industry Research and independent sources. Fitch Ratings analysts do not share data or information with Fitch Solutions Country Risk & Industry Research.
EMISPDF in-beroe04 from 137.97.88.22 on 2021-07-20 11:15:35 BST. DownloadPDF. fitchsolutions.com Downloaded by in-beroe04 from 137.97.88.22 at 2021-07-20 11:15:35 BST. EMIS. Unauthorized Distribution Prohibited.
12
Indonesia Freight Transport & Shipping Report | Q2 2021
Growth To Return From 2021 Onwards Indonesia - Road Freight Tonnage (2019-2025)
e/f = estimate/forecast. Source: Fitch Solutions
Medium Term Road freight volumes will remain positive in the coming years. A resumption in economic activity across various industries will result in strong road freight demand, particularly from the construction sector. The 2020 shift to e-commerce platforms is likely to have a permanent positive impact on e-commerce volumes. We forecast average annual growth of 2.0% between 2021 and 2025, a scenario that would see tonnage handled on the country’s roads reach 1.5bn by the end of 2025. The government's commitment to investing to correct Indonesia's deficit in transport infrastructure supports our relatively robust growth forecasts in this sub-sector. Road projects will be the main growth driver in Indonesia's transport infrastructure sector over the 2019-2029 period, with a large amount of public and private investment in toll expressways and urban highways. The country's existing road networks vary greatly in terms of quality, while expressways in industrialised regions, such as Java, are fairly well developed. Underdeveloped roads in lesspopulated regions continue to be an impediment to economic growth. To address shortcomings in the national road network and increase the country's logistics capacity, the government announced plans at the end of 2019 to build more than 4,000km of new roads in the next five years, as part of Indonesia's Vision 2030 plan. The plan involves 1,500km of toll roads, 2,509km of national roads and 60km of elevated bridges or overpasses. In May 2020, President Joko Widodo issued a new regulation that expands the types of land that can be unilaterally acquired by the state for purposes deemed to be in the public interest. On the government’s docket are 89 projects, most of them newly proposed and the rest expansions of existing projects. The common hurdle is land acquisition, according to Widodo. In a May 2020, in a conference call to announce the slate of projects, tagged at a combined USD100bn, Widodo called them a national priority and said they 'have to continue'. Among the 89 priority projects are road projects planned across Kalimantan. The government is banking on these projects to be eased through by a deregulation bill that’s currently in parliament. Though we note that many of these projects are likely to be delayed due to the Covid-19 pandemic, we expect strong expansion of road infrastructure.
THIS COMMENTARY IS PUBLISHED BY FITCH SOLUTIONS COUNTRY RISK & INDUSTRY RESEARCH and is NOT a comment on Fitch Ratings' Credit Ratings. Any comments or data included in the report are solely derived from Fitch Solutions Country Risk & Industry Research and independent sources. Fitch Ratings analysts do not share data or information with Fitch Solutions Country Risk & Industry Research.
EMISPDF in-beroe04 from 137.97.88.22 on 2021-07-20 11:15:35 BST. DownloadPDF. fitchsolutions.com Downloaded by in-beroe04 from 137.97.88.22 at 2021-07-20 11:15:35 BST. EMIS. Unauthorized Distribution Prohibited.
13
Indonesia Freight Transport & Shipping Report | Q2 2021
Long Term Road freight will grow strongly out to 2030, tracking the performance of the broader economy. The government aims to shift tonnage from road to new rail infrastructure over the next decade, but this will only modestly dilute growth in road freight tonnage. With Java the only island currently served by railway infrastructure, road will retain its dominance in freight transport for the country as a whole for at least the next decade. By 2030, we expect road to account for 96% of Indonesia's total freight volumes. Over the long term, investment and construction activity within the roads infrastructure sector will be sustained as Indonesia's vehicles fleet and road traffic levels continue to grow in line with its economic development. Our Autos team forecasts that the vehicle fleet in Indonesia will grow by 56.3% between 2021 and 2029, totalling nearly 50mn. Within developed regions, such as Java, this growth will further worsen traffic congestion, limiting the efficiency of logistics and supply chains in Indonesia. Investment in high-capacity roads will therefore be necessary to unlock greater industrial development, while the tolled nature of expressways in Indonesia also means that investors will also have greater potential for returns. Congestion in Jakarta alone is estimated to cost USD3bn per year in lost productivity. ROAD FREIGHT (INDONESIA 2019-2025) Indicator Road Freight Tonnes (000) Road freight tonnes, % y-o-y
2019e
2020e
2021f
2022f
2023f
2024f
2025f
1,480,964
1,326,259
1,352,216
1,376,965
1,406,026
1,435,450
1,466,677
0.0
-10.4
2.0
1.8
2.1
2.1
2.2
e/f = Fitch Solutions estimate/forecast. Source: National sources, Fitch Solutions
THIS COMMENTARY IS PUBLISHED BY FITCH SOLUTIONS COUNTRY RISK & INDUSTRY RESEARCH and is NOT a comment on Fitch Ratings' Credit Ratings. Any comments or data included in the report are solely derived from Fitch Solutions Country Risk & Industry Research and independent sources. Fitch Ratings analysts do not share data or information with Fitch Solutions Country Risk & Industry Research.
EMISPDF in-beroe04 from 137.97.88.22 on 2021-07-20 11:15:35 BST. DownloadPDF. fitchsolutions.com Downloaded by in-beroe04 from 137.97.88.22 at 2021-07-20 11:15:35 BST. EMIS. Unauthorized Distribution Prohibited.
14
Indonesia Freight Transport & Shipping Report | Q2 2021
Rail Freight Forecast Key View: Rail freight volumes will rebound strongly in the short-to-medium term, owing to a recovery in mining and construction sector activity, and significant investment planned into Indonesia's rail infrastructure. We forecast growth in Indonesia's railways subsector to accelerate in the coming decade on the back of vast development plans in Sumatra and Sulawesi, although we note our outlook is tempered by challenges faced by current projects, which will continue to affect the sub-sector without reform progress. Latest Updates • In December 2020, PT Kereta Cepat Indonesia China (KCIC) announced that it had completed 63.9% of construction on the Jakarta-Bandung high-speed rail (HSR), overcoming delays due to the Covid-19 pandemic. On December 15, it was announced that the tunnel drilling for South East Asia's first HSR project had reached 74.9% completion. KCIC has pushed back its completion and operation target to H221, from the initial target of June 2021, due to a combination of challenges in 2020. • On September 21 2020, Transportation Minister Budi Karya Sumadi inaugurated the reactivated Cianjur-Cipatat railroad network in West Java as part of the government’s plan to reduce road traffic, especially in Bogor, Sukabumi and Padalarang and the surrounding areas. The ministry reportedly spent IDR118.8bn (USD8mn) from its 2019 budget to reactivate the CiranjangCipatat segment. It aims to start work on the final segment of the network by 2022.
Short Term Rail freight volumes will rebound strongly in the short term (2021), due to a recovery in mining and construction sector activity. We forecast rail freight volumes to grow by 5.9% over 2021. On September 21 2020, Transportation Minister Budi Karya Sumadi inaugurated the reactivated Cianjur-Cipatat railroad network in West Java as part of the government’s plan to reduce road traffic, especially in Bogor, Sukabumi and Padalarang and the surrounding areas. Through the rail network reactivation, the ministry hopes to cut travel time between Cipatat and Sukabumi to 2.5 hours by train, 30 minutes less than the average travel time by road. The ministry also hopes to increase the number of daily train passengers on the route from around 2,100 to 6,500. Moreover, the ministry hopes to increase rail freight capacity from 30 tonnes per day to 42 tonnes by adding a sixth car to freight trains. The ministry aims to start work on the final segment of the network, which will connect the stations of Cipatat and Padalarang, by 2022. In December 2020, railway developer KCIC announced that it had completed 63.9% of construction on the Jakarta-Bandung HSR, overcoming delays due to the Covid-19 pandemic. On December 15, it was announced that the tunnel drilling for South East Asia's first HSR project had reached 74.9% completion. Due to a combination of challenges in 2020, KCIC has pushed back its completion and operation target to H221, from the initial target of June 2021. The USD6.07bn HSR will link Indonesia's biggest city Jakarta and its fourth largest city, Bandung. Travel time between the two cities will take just 45 minutes (compared to five hours or more by road) carrying 601 passengers on each trip. The existing railway line takes about three hours to travel between the two cities. The HSR is expected to travel at speeds of up to 350km per hour, with two stops between both cities.
THIS COMMENTARY IS PUBLISHED BY FITCH SOLUTIONS COUNTRY RISK & INDUSTRY RESEARCH and is NOT a comment on Fitch Ratings' Credit Ratings. Any comments or data included in the report are solely derived from Fitch Solutions Country Risk & Industry Research and independent sources. Fitch Ratings analysts do not share data or information with Fitch Solutions Country Risk & Industry Research.
EMISPDF in-beroe04 from 137.97.88.22 on 2021-07-20 11:15:35 BST. DownloadPDF. fitchsolutions.com Downloaded by in-beroe04 from 137.97.88.22 at 2021-07-20 11:15:35 BST. EMIS. Unauthorized Distribution Prohibited.
15
Indonesia Freight Transport & Shipping Report | Q2 2021
Steady Growth Over Short-To-Medium Term Indonesia - Rail Freight Tonnage (2019-2025)
e/f = Fitch Solutions estimate/forecast. Source: National Statistics Agency, Fitch Solutions
Medium Term We expect that rail freight volumes will grow steadily over the medium term (2021-2025), due to both a recovery in mining and construction sector activity, and significant investment planned into Indonesia's rail infrastructure. We forecast rail freight to grow at an annual average rate of 5.7% over 2021-2025. Rail freight growth will receive little boost from growth in the coal sector over the medium term. The possibility of coal export restrictions or of a complete ban will remain a concern over the coming years. As domestic demand increases and the government is faced with the challenge of depleting domestic reserves, the question of energy security will increase the likelihood of such a policy in the next four to five years and beyond. We currently expect Indonesia's annual coal production to grow moderately over the medium term, averaging a sluggish growth rate of less than 1.0% annually in line with lower coal prices, poor transport and stringent regulations that will increase costs for miners. Indonesia's agriculture holds a great amount of promise and sub-sectors such as livestock, sugar and palm oil will experience significant growth opportunities, which is welcome news to the country's rail freight mode owing to this sub-sector being key in the supply chain. However, the country's goal to become self-sufficient in a large number of commodities is overly ambitious in light of the robust outlook for food and drink consumption. Agricultural production will struggle to expand in the coming years amid scarce agricultural land, the lack of proper infrastructure and the existence of a large number of low-technology, small-scale farmers. While we believe that Indonesia will be able to reduce its dependence on rice imports in the coming years, we do not believe that the country will reach sugar, corn and beef self-sufficiency over the medium term.
Long Term Maximum efficiency of rail freight is achieved when high bulk/low unit value cargoes are carried over long distances. This explains why rail is so effective in countries and regions with very large land masses (among them Russia, India, the US and the EU). It also explains why there are limits on the long-term expansion of rail in the Indonesian archipelago. Bearing that restriction in mind, there remains significant room for growth in the use of rail networks in the larger islands of Java and Sumatra. While Indonesia's railway industry remains a distant second in terms of value compared to the roads industry, the government has THIS COMMENTARY IS PUBLISHED BY FITCH SOLUTIONS COUNTRY RISK & INDUSTRY RESEARCH and is NOT a comment on Fitch Ratings' Credit Ratings. Any comments or data included in the report are solely derived from Fitch Solutions Country Risk & Industry Research and independent sources. Fitch Ratings analysts do not share data or information with Fitch Solutions Country Risk & Industry Research.
EMISPDF in-beroe04 from 137.97.88.22 on 2021-07-20 11:15:35 BST. DownloadPDF. fitchsolutions.com Downloaded by in-beroe04 from 137.97.88.22 at 2021-07-20 11:15:35 BST. EMIS. Unauthorized Distribution Prohibited.
16
Indonesia Freight Transport & Shipping Report | Q2 2021
sizeable development plans focused on improving inland freight logistics, intercity passenger rail and urban transit. Policy continuity and land acquisition hurdles faced by high-profile projects in Java highlight the risks to implementation of these plans. We forecast growth in Indonesia's rail sub-sector to accelerate in the coming decade on the back of vast development plans in Sumatra and Sulawesi, although we note our outlook is tempered by challenges faced by current projects, which will continue to affect the subsector without reform progress. RAIL FREIGHT (INDONESIA 2019-2025) Indicator Rail freight tonnes ('000) Rail freight tonnes, % y-o-y
2019
2020e
2021f
2022f
2023f
2024f
2025f
51,106.0
48,898.2
51,779.6
54,526.8
57,752.8
61,019.0
64,485.5
3.5
-4.3
5.9
5.3
5.9
5.7
5.7
e/f = Fitch Solutions estimate/forecast. Source: Statistics Indonesia, Fitch Solutions
THIS COMMENTARY IS PUBLISHED BY FITCH SOLUTIONS COUNTRY RISK & INDUSTRY RESEARCH and is NOT a comment on Fitch Ratings' Credit Ratings. Any comments or data included in the report are solely derived from Fitch Solutions Country Risk & Industry Research and independent sources. Fitch Ratings analysts do not share data or information with Fitch Solutions Country Risk & Industry Research.
EMISPDF in-beroe04 from 137.97.88.22 on 2021-07-20 11:15:35 BST. DownloadPDF. fitchsolutions.com Downloaded by in-beroe04 from 137.97.88.22 at 2021-07-20 11:15:35 BST. EMIS. Unauthorized Distribution Prohibited.
17
Indonesia Freight Transport & Shipping Report | Q2 2021
Air Freight Forecast Key View: We expect air freight to return to positive growth territory from 2021 onwards, following two years of negative growth. For much of 2020, the Covid-19 pandemic hit the air freight sub-sector particularly hard, resulting in significantly lower air freight volumes. As the Covid-19 outbreak continues to rise in Indonesia, we note that risks to our short-term forecast is weighted to the downside. Although air passenger traffic was showing improvements in late Q420, the ban on all international arrivals from January 1 to 14 2021 has given Indonesia's air passenger traffic a rough start to the year. Latest Updates • On December 28 2020, the Foreign Affairs Ministry announced a ban on all international arrivals from January 1 to 14 2021 as the government seeks to prevent an outbreak of the new strain of Covid-19 first discovered in the UK. The ministry’s new policy also required international travelers arriving between December 28 and 31 2020 to undergo a five-day quarantine period at a government-assigned accommodation. • According to the Central Statistics Agency (BPS), Indonesia recorded a 33.43% m-o-m increase in domestic air passenger traffic in November 2020, with the number of flyers rising to 2.97mn compared to 2.22mn in October. According to the BPS deputy chief for distribution and service statistics, the number of international air passengers also rose by 15.8% to 44,700 in November. • Angkasa Pura I shortlisted 26 companies to jointly develop and manage Lombok International Airport. Singapore’s Changi Airport Group, South Korea’s Incheon International Airport, Germany’s Fraport and India’s GMR Airports are among the companies shortlisted. The project is estimated to cost around IDR10.3trn (USD953mn) and involves extending the existing runway and expanding the terminal space. Redevelopment works are expected to be completed by 2021. • Construction of the Soekarno-Hatta International Airport II in Karawang, West Java, Indonesia, is slated to start in 2028. The airport, spanning 3sq km, will come up between the Ciampel and Pangkalan districts. Pre-construction activities, including a detailed engineering design study, are scheduled to start in 2027. The project, when completed, will support the operations of the existing airport. Short Term We forecast air freight to return to positive growth territory in the short term to 2021, reaching 981,700 tonnes and a 4.5% y-o-y increase. This follows two consecutive years of decline. However, risks to our forecast are weighted to the downside as the Covid-19 outbreak continues to rise in Indonesia. The Covid-19 pandemic has dragged down air freight volumes via two main channels. First, the pandemic has caused a sharp slowdown in Indonesia's economic growth, resulting in weaker household incomes and a reduction in expenditure on luxury products that are typically air freighted. Second, social distancing measures have resulted in a collapse in passenger air volumes. Following a strong rebound between June and July 2020, Indonesia’s air passenger traffic experienced a setback in September amid the government’s large-scale social restrictions (PSBB) and low public confidence to fly during the Covid-19 pandemic. State-owned airport operator Angkasa Pura II recorded a 2.6% decline in passenger movements at the 19 airports it manages during the first two weeks of September, compared to the same period in August. According to the BPS, Indonesia recorded a 33.43% m-o-m increase in domestic air passenger traffic in November 2020, with the number of flyers rising to 2.97mn compared to 2.22mn In October. However, on December 28, the Foreign Affairs Ministry announced a ban on all international arrivals from January 1 to 14 2021 as the government seeks to prevent an outbreak of the new strain of Covid-19 first discovered in the UK. The ministry’s new policy also required international travelers arriving between December 28 and 31 to undergo a five-day quarantine period at a governmentassigned accommodation. This has given Indonesia’s air passenger traffic a rough start in 2021. Angkasa Pura I shortlisted 26 companies to jointly develop and manage Lombok International Airport. Singapore’s Changi Airport Group, South Korea’s Incheon International Airport, Germany’s Fraport and India’s GMR Airports are among the companies shortlisted. The agreement covers design-build-finance-operate-transfer works over a span of 30 years. The project is estimated to cost around IDR10.3trn (USD953mn) and involves extending the existing runway from 2,750m to 3,330m and expanding the THIS COMMENTARY IS PUBLISHED BY FITCH SOLUTIONS COUNTRY RISK & INDUSTRY RESEARCH and is NOT a comment on Fitch Ratings' Credit Ratings. Any comments or data included in the report are solely derived from Fitch Solutions Country Risk & Industry Research and independent sources. Fitch Ratings analysts do not share data or information with Fitch Solutions Country Risk & Industry Research.
EMISPDF in-beroe04 from 137.97.88.22 on 2021-07-20 11:15:35 BST. DownloadPDF. fitchsolutions.com Downloaded by in-beroe04 from 137.97.88.22 at 2021-07-20 11:15:35 BST. EMIS. Unauthorized Distribution Prohibited.
18
Indonesia Freight Transport & Shipping Report | Q2 2021
terminal space by 40,000sq m to accommodate up to 7mn passengers annually (the current capacity in 3mn). Redevelopment works are expected to be completed by 2021.
Steady Growth Over The Medium Term Indonesia - Air Freight Tonnage (2019-2025)
e/f = Fitch Solutions estimate/forecast. Source: National Statistics Agency, Fitch Solutions
Medium Term Growth in air freight volumes will remain steady over the medium term. We forecast average annual growth of 4.5% over 2021-2025, a scenario that would see total tonnage handled by air come in at around 1.2mn tonnes by the end of 2025. Intra-Asia trade is developing, and we have already seen the steady expansion of this trend in the container shipping sector. We believe that its development will accelerate in the air freight market over the medium term. Natural disasters, such as the September 2018 earthquakes in Sulawesi, create risks of disruption to airport operations. Overall, we expect Indonesia's airline passenger rates to keep rising, with high GDP income per capita facilitating more air travel among the islands of the country's archipelago. A virtual groundbreaking ceremony took place for the Kediri Airport in Kediri regency, East Java, which is expected to be completed in 2022. Gudang Garam, through its subsidiary Surya Dhoho Investama, is set to spend around IDR10trn (USD732.4mn) to build the airport, including the acquisition of about 400 hectares of land. The airport, the construction of which is being fully funded by the company, is expected to be bigger than Abdul Rachman Saleh Airport in Malang and accommodate about 5mn passengers per year. Once completed, it will have a 3,000m by 45m runway that will be able to accommodate a wide range of aircraft, from Boeing B777s to Airbus A350s, as well as a passenger terminal, cargo terminal and parking area. It is expected to reduce the overburdened Juanda International Airport in Surabaya, the capital of East Java, about a two-hour drive from Kediri.
Long Term Air freight capacity will be supported by significant airports infrastructure investment over the coming decade. There is a healthy pipeline of civil projects relating to the expansion of existing airport facilities, as well as proposals to construct new airports to increase accessibility of various locations across the sprawling archipelago. Strong project activity over the coming years is reflected THIS COMMENTARY IS PUBLISHED BY FITCH SOLUTIONS COUNTRY RISK & INDUSTRY RESEARCH and is NOT a comment on Fitch Ratings' Credit Ratings. Any comments or data included in the report are solely derived from Fitch Solutions Country Risk & Industry Research and independent sources. Fitch Ratings analysts do not share data or information with Fitch Solutions Country Risk & Industry Research.
EMISPDF in-beroe04 from 137.97.88.22 on 2021-07-20 11:15:35 BST. DownloadPDF. fitchsolutions.com Downloaded by in-beroe04 from 137.97.88.22 at 2021-07-20 11:15:35 BST. EMIS. Unauthorized Distribution Prohibited.
19
Indonesia Freight Transport & Shipping Report | Q2 2021
in our Key Projects Database - there are currently 21 airport projects in the pipeline, worth an estimated USD12.1bn. This includes the planned construction of the new South Banten Airport and the expansion of the existing Soekarno-Hatta International Airport in Jakarta, both of which are projects placed under the list of National Strategic Projects identified by Jokowi's administration. Over the past decade, the number of domestic passengers handled increased by an average of 10.7% y-o-y annually, from 75mn passengers to almost 200mn passengers in 2017, putting a strain on existing facilities. Similarly, we note high growth in international passenger traffic, though it continues to constitute a small proportion of total passengers handled. Looking ahead, the International Air Transport Association expects the country to become the fourth biggest aviation market in the world, handling more than 400mn passengers by 2037. Contributing to this is the aforementioned Kediri Airport, which is expected to be completed in two years and is expected to be bigger than Abdul Rachman Saleh Airport in Malang and accommodate about 5mn passengers per year. We believe bulk of the increase in traffic will be driven by the domestic aviation sector, with Jokowi's plans to develop other major locations outside of Java necessitating the enhancement of air connectivity across the archipelago, as well as rising affluence of the general population, being primary factors supporting our view. Also, the introduction of new domestic routes and the expansion of fleet sizes by domestic low cost carriers such as Citilink, Lion Air and AirAsia Indonesia are signals supporting the growth in demand for domestic travel. AIR FREIGHT (INDONESIA 2019-2025) Indicator Air Freight Tonnes (000) Air freight tonnes % y-o-y Air freight tonnes-km (mn ton km) Air freight tonnes-km % y-o-y
2019e
2020e
2021f
2022f
2023f
2024f
2025f
1,049.0
939.4
981.7
1,022.0
1,069.3
1,117.2
1,168.1
-0.1
-10.5
4.5
4.1
4.6
4.5
4.6
1,130
1,008
1,065
1,120
1,184
1,250
1,319
-0.1
-10.8
5.7
5.1
5.7
5.5
5.5
e/f = Fitch Solutions estimate/forecast. Source: National Statistics Agency, World Bank Indicators, Fitch Solutions
THIS COMMENTARY IS PUBLISHED BY FITCH SOLUTIONS COUNTRY RISK & INDUSTRY RESEARCH and is NOT a comment on Fitch Ratings' Credit Ratings. Any comments or data included in the report are solely derived from Fitch Solutions Country Risk & Industry Research and independent sources. Fitch Ratings analysts do not share data or information with Fitch Solutions Country Risk & Industry Research.
EMISPDF in-beroe04 from 137.97.88.22 on 2021-07-20 11:15:35 BST. DownloadPDF. fitchsolutions.com Downloaded by in-beroe04 from 137.97.88.22 at 2021-07-20 11:15:35 BST. EMIS. Unauthorized Distribution Prohibited.
20
Indonesia Freight Transport & Shipping Report | Q2 2021
Shipping Forecast Key View: We expect port throughput volumes to remain in positive growth territory over the medium term (2021-2025), following two years of negative growth. This is in line with a general recovery in global and domestic economic growth. Exports of mining products were weakened in 2020 by lower demand from Indonesia's export partners and lower output at many mines. However, activities continued to pick up steadily from late-Q420, particularly as China continues to increase its dependency on Indonesian coal. Our long-term forecasts envisage steady growth rates at both of Indonesia's major ports.
Latest Updates • On December 20 2020, Indonesian President Joko Widodo inaugurated the new port of Patimban, one of the largest seaports in the country. The USD3bn facility in West Java was partially funded with USD1.2bn in backing from the Japanese government. At least 10 different automakers (among which include several Japanese brands) have plants located near the seaport, and the development will help to lower their shipping costs. • Time charter equivalent (TCE) rates on Kamsarmax class bulkers trading in South East Asia almost doubled over November to December 2020, as China continues to increase its dependency on Indonesian coal while indicating that it may open up its borders for more imported coal. This trend caused TCE rates for Kamsarmax consuming bunker fuel to rise 0.5%, opening at South China, to jump 75% from USD8,692 per day in mid-November for a trip via Indonesia with coal touching USD15,176 per day on December 15. • According to Refinitiv shipping data, imports from Indonesia were 5.38mn tonnes in September 2020, down from 6.07mn the prior month and 7.15mn in September 2019. The fall in imports is likely to be due to the ongoing struggles of coal-fired power generators in the face of cheaper renewable energy sources, such as solar and wind, and also rising production by Coal India. Coal India reported output jumping 32% to 40.51mn tonnes in September 2020 from the same month in the previous year. • Indonesia's refined tin supply will be constrained due to a tightening of the country's rules for tin shipments in a fresh bid to crack down on environmental damage and smuggling, and improve the enforcement of royalties and tax payments on shipments. In order to continue shipments, Indonesian exporters will have to prove that they acquired their tin ore raw material from mines that are certified 'Clean and Clear'. Producers will also have to secure an export permit from the Trade Ministry, which they can only do after securing an export recommendation from the Energy and Resources Ministry. Registered tin exporters are struggling to obtain the 'Clean and Clear' certification from the government, which has been a requirement in order to export tin from November 1 2015. As of June 2016, only 498 out of 755 IUP mining licence-holders had obtained the 'Clean and Clear' certification.
Short Term We forecast port throughput volumes to return to positive growth territory in the short term. The port of Tanjung Priok will see container throughput grow by 6.4% y-o-y in 2021 to reach 5.6mn twenty-foot equivalent unit (TEU)s, while tonnage throughput will grow by 2.7% to 23.0mn tonnes. This follows two consecutive years of decline. In 2020, shipping volumes at Indonesia's main ports contracted in line with a slowdown in economic activity in the country. The Covid-19 pandemic caused slower economic growth and thus import demand of bulk and containerised products. For instance, a surge in unemployment and lower household incomes will drive down import demand for non-essential retail products. The shutdown of many major construction projects in line with social distancing measures also undermined imports of construction materials and capital equipment. We note that risks to our forecast for 2021 are weighted to the downside as the rate of Covid-19 infections continue to rise in Indonesia. According to Refinitiv shipping data, imports from Indonesia were 5.38mn tonnes in September 2020, down from 6.07mn the prior month and 7.15mn in September 2019. The fall in imports is likely to be due to the ongoing struggles of coal-fired power THIS COMMENTARY IS PUBLISHED BY FITCH SOLUTIONS COUNTRY RISK & INDUSTRY RESEARCH and is NOT a comment on Fitch Ratings' Credit Ratings. Any comments or data included in the report are solely derived from Fitch Solutions Country Risk & Industry Research and independent sources. Fitch Ratings analysts do not share data or information with Fitch Solutions Country Risk & Industry Research.
EMISPDF in-beroe04 from 137.97.88.22 on 2021-07-20 11:15:35 BST. DownloadPDF. fitchsolutions.com Downloaded by in-beroe04 from 137.97.88.22 at 2021-07-20 11:15:35 BST. EMIS. Unauthorized Distribution Prohibited.
21
Indonesia Freight Transport & Shipping Report | Q2 2021
generators in the face of cheaper renewable energy sources, such as solar and wind, and also rising production by Coal India. Coal India reported output jumping 32% to 40.51mn tonnes in September 2020 from the same month in the previous year. The data suggests that India’s steel and industrial sectors are recovering faster than the coal-fired power sector, which will pose short-term challenges to Indonesia, as it is India’s top supplier. TCE rates on Kamsarmax class bulkers trading in South East Asia almost doubled over November to December 2020, hitting a 13-month high as China continues to increase its dependency on Indonesian coal while indicating that it may open up its borders for more imported coal. This trend caused TCE rates for Kamsarmax consuming bunker fuel to rise 0.5%, opening at South China, to jump 75% from USD8,692 per day in mid-November for a trip via Indonesia with coal touching USD15,176 per day on December 15. In addition, TCE for trips towards East and West Coasts of India reached USD14,293/d and USD14,197/d, up 64.77% and 65.63% respectively. All are at the highest levels since the assessments were launched in November 2019.
Steady Growth Over Medium Term Port Of Tanjung Priok Container Throughput, TEUs, % Change y-o-y (2019-2025)
e/f = Fitch Solutions estimate/forecast. Source: Port authority, Fitch Solutions
Medium Term Port throughput volumes remain positive over the medium term (2021-2025), in line with a general rebound in global and domestic economic growth. The largest port in Indonesia, Tanjung Priok, is set to register average annual tonnage and container throughput growth of 2.7% and 6.0% respectively over 2021-2025. The Indonesian government wishes to see traffic increase at the port of Tanjung Priok in a bid to become an international transhipment hub. There are hopes that traffic will grow from 7mn TEUs to 15mn TEUs over the next three years, which would provide large upside risks to our forecasts for the port going forward. Bulk exports will be fairly stagnant in the medium term due to weak mining sector export growth, particularly coal. Indonesia's coal production growth will slow to less than 1.0% per year as the government's ongoing clampdown on illegal coal mines and rising royalties and regulations for registered ones undermine operations. Indonesian coal exports have largely been on a year-on-year declining track since October 2018, on the back of poor international demand and rising domestic demand from Indonesia's power sector.
THIS COMMENTARY IS PUBLISHED BY FITCH SOLUTIONS COUNTRY RISK & INDUSTRY RESEARCH and is NOT a comment on Fitch Ratings' Credit Ratings. Any comments or data included in the report are solely derived from Fitch Solutions Country Risk & Industry Research and independent sources. Fitch Ratings analysts do not share data or information with Fitch Solutions Country Risk & Industry Research.
EMISPDF in-beroe04 from 137.97.88.22 on 2021-07-20 11:15:35 BST. DownloadPDF. fitchsolutions.com Downloaded by in-beroe04 from 137.97.88.22 at 2021-07-20 11:15:35 BST. EMIS. Unauthorized Distribution Prohibited.
22
Indonesia Freight Transport & Shipping Report | Q2 2021
Looking at the wider mining sector, Indonesia announced in September 2019 that it would bring forward a nickel ore export ban that was to go into effect in January 2022 by two years. The ban was lifted in January 2020. This decision reinforces the country's reputation of high policy uncertainty and poor mining operating environment. We have been cautious regarding our mining stance on Indonesia for a while since the government implemented and then relaxed the mineral ore export ban in 2014 and 2017 respectively, citing in previous analyses rising resource nationalism and increasing risks to foreign mining investors in the coming years. In the long term, Indonesia is likely to stay one of the largest wheat importers globally. Indonesia was the second largest wheat importer in 2018, with total shipments of 10.1mn tonnes. The country has consistently ranked among the top five importers since 2012. Indonesia will continue to record robust consumption growth, which will strongly push the need for imports in the coming years.
Long Term We maintain our view for strong economic growth and consumption rates of over 5% in Indonesia out to 2030. These should continue to boost ocean shipping over the course of the long term. Our long-term forecasts envisage steady growth rates at both of Indonesia's major ports. The port of Tanjung Priok will see throughput and box volume growth of 2.9% y-o-y and 6.0% y-o-y respectively over 2021-2030. The major problem facing Indonesia's container maritime sector in the short term is the comparatively underdeveloped level of its port infrastructure. According to the 2019 World Economic Forum Global Competitiveness Index, the country's ports rank in 36th position in global terms (up from 43rd in 2018). The country's ports have not developed quickly enough to keep up with Indonesia's macroeconomic growth and are plagued by congestion and backlogs. The Jokowi administration has placed emphasis on improving Indonesian ports' efficiency and competitiveness as part of his economic and political initiative of transforming the country into a global maritime axis. To achieve this, the government will require IDR700trn (USD55.4bn) to develop 24 commercial seaports and more than 1,000 domestic ports and to procure vessels for its marine-highway program. Although the maritime sector is of immense strategic and economic importance to the archipelago nation, Indonesia's ports have suffered from perennial underinvestment and are highly inefficient. Jokowi is also pursuing a network of sea toll roads - a domestic maritime corridor that aims to improve logistics flows and reduce the costs of transporting goods between Indonesia's many islands - especially to and from the eastern provinces of Papua, West Papua, Maluku and North Maluku. The network will be centred on six major seaports near five cities: Belawan near Medan, Batam, Tanjung Priok in Jakarta, Tanjung Perak in Surabaya, Makassar and Sorong. Indonesia began a IDR43.2trn (USD3.0bn) project in August 2018 to develop Patimban port in Subang, West Java. Penta-Ocean Construction, TOA Corporation, Rinkai Nissan Construction, Wijaya Karya and Pembangunan Perumahan will implement the three-phase scheme, which is expected to reduce congestion at Tanjung Priok port in North Jakarta. The overall port will be ready by 2027.
THIS COMMENTARY IS PUBLISHED BY FITCH SOLUTIONS COUNTRY RISK & INDUSTRY RESEARCH and is NOT a comment on Fitch Ratings' Credit Ratings. Any comments or data included in the report are solely derived from Fitch Solutions Country Risk & Industry Research and independent sources. Fitch Ratings analysts do not share data or information with Fitch Solutions Country Risk & Industry Research.
EMISPDF in-beroe04 from 137.97.88.22 on 2021-07-20 11:15:35 BST. DownloadPDF. fitchsolutions.com Downloaded by in-beroe04 from 137.97.88.22 at 2021-07-20 11:15:35 BST. EMIS. Unauthorized Distribution Prohibited.
23
Indonesia Freight Transport & Shipping Report | Q2 2021
MAJOR PORTS DATA (INDONESIA 2019-2025) Indicator Port of Tanjung Priok tonnage throughput, tonnes '000 Port of Tanjung Priok tonnage throughput, tonnes, % y-o-y Port of Tanjung Priok container throughput, TEU Port of Tanjung Priok container throughput, TEU, % yo-y
2019
2020e
2021f
2022f
2023f
2024f
2025f
25,642
22,317
22,923
23,529
24,168
24,843
25,554
-1.5
-13.0
2.7
2.6
2.7
2.8
2.9
5,934,300 5,223,058 5,556,521 5,890,013 6,241,789 6,612,883 7,004,391 -12.0
-12.0
6.4
6.0
6.0
5.9
5.9
e/f = Fitch Solutions estimate/forecast. Source: Port Authority, Fitch Solutions
THIS COMMENTARY IS PUBLISHED BY FITCH SOLUTIONS COUNTRY RISK & INDUSTRY RESEARCH and is NOT a comment on Fitch Ratings' Credit Ratings. Any comments or data included in the report are solely derived from Fitch Solutions Country Risk & Industry Research and independent sources. Fitch Ratings analysts do not share data or information with Fitch Solutions Country Risk & Industry Research.
EMISPDF in-beroe04 from 137.97.88.22 on 2021-07-20 11:15:35 BST. DownloadPDF. fitchsolutions.com Downloaded by in-beroe04 from 137.97.88.22 at 2021-07-20 11:15:35 BST. EMIS. Unauthorized Distribution Prohibited.
24
Indonesia Freight Transport & Shipping Report | Q2 2021
Market Overview Although Indonesia benefits from close proximity to some of the world's most important shipping routes and key Asian economies, its attractive freight market is held back by its lack of railways and paved roads on the vast majority of the country's 17,000 islands. As a result, the country lacks efficient, well-functioning supply chains. Freight transport is heavily reliant on roads, but they are poorly maintained and their standard varies greatly across the country.
Heavy Reliance On Road Indonesia - Freight Mode Breakdown (2019-2030)
Note: Data for certain freight modes can vary, affecting the chart display. See Freight Mode Breakdown table below. e/f = Fitch Solutions estimate/forecast. Source: National sources, Fitch Solutions
Road The over-reliance of supply chains on the road network in Indonesia poses a variety of problems, because roads suffer from a deficit in both quality and coverage, which leads to significant delays. The lack of alternatives for internal freight transport also causes congestion and means any disruption to the road network, which is frequently caused by natural disasters, is very costly to businesses. While Indonesia has the second most extensive road network in the East And South East Asian region, it also has one of the lowest road densities in the region. This is due to the country's topographical nature. Therefore, the road network varies greatly across the Indonesian archipelago, with the best road connections being located on the more highly populated islands of Sumatra, Java and Bali. In Sumatra, one major road connects Banda Aceh on the northern tip of the island to Bandar Lampung in the south, and the ferry connection to Merak on the island of Java. There is a short section of toll road linking the port at Belawan to the largest city of Medan and the main north-south highway. In Java, major toll roads run from the port of Merak in the east to Jakarta, and onwards to Bandung. Infrastructure quality varies greatly between islands. The major highways linking the main urban areas, seaports and airports, particularly along the northern coast, are in good condition. Roads are also reasonably good on the popular tourist island of Bali, linking the main airport to tourist resorts and the ferry to Java. The remaining larger islands, such as Kalimantan (Indonesian Borneo), Sulawesi and Papua (Indonesian New Guinea), as well as most smaller islands, have far worse road networks. Supply chains in these islands are therefore more reliant on air, sea and inland river transport. The US Department of State Crime and Safety 2019 Report THIS COMMENTARY IS PUBLISHED BY FITCH SOLUTIONS COUNTRY RISK & INDUSTRY RESEARCH and is NOT a comment on Fitch Ratings' Credit Ratings. Any comments or data included in the report are solely derived from Fitch Solutions Country Risk & Industry Research and independent sources. Fitch Ratings analysts do not share data or information with Fitch Solutions Country Risk & Industry Research.
EMISPDF in-beroe04 from 137.97.88.22 on 2021-07-20 11:15:35 BST. DownloadPDF. fitchsolutions.com Downloaded by in-beroe04 from 137.97.88.22 at 2021-07-20 11:15:35 BST. EMIS. Unauthorized Distribution Prohibited.
25
Indonesia Freight Transport & Shipping Report | Q2 2021
for Indonesia notes that road conditions vary across Indonesia, with toll roads being modern, having multiple lanes and being well maintained. On the other hand, many roads outside major Indonesian cities have single lanes and are not well maintained.
Rail Railways in Indonesia offer a limited degree of diversification for supply chains. The railway network on the island of Java, the main economic and population centre of the country, offers both good quality and fairly extensive coverage, providing links to towns and cities as well as seaports and airports. However, Java is the only island in the archipelago with an integrated and well-developed railway network and it remains largely geared towards passenger rather than freight transport. Indonesia has the second longest railway system in the East And South East Asian region. Nevertheless, most of the country remains inaccessible via rail as it has a low railway density. Two major rail lines run the length of Java from east to west, linking ports and major urban areas throughout the island from Merak in the west via Jakarta, Bandung, Semarang, Yogyakarta and Surabaya, to the ferry connection to Bali at Banyuwangi in the east, with several branch lines providing additional connections. The remaining islands of the Indonesian archipelago are not served by railways. There is good potential for rail freight transport, especially due to the good connections to major ports, although passenger services currently take precedent. Indonesia's railways are of relatively high quality in a regional comparison, which is an advantage for supply chains as it allows for faster and more efficient transport of goods to and from ports to inland areas of Java. However, the entire network is narrow gauge, which means that the speed of trains and the number of services are limited. A problem which is further exacerbated by the fact that only around 565km of the Indonesian railway system is electrified. Air There are an estimated 673 airports in Indonesia, reflecting its geographic composition and the importance of air travel for reaching more remote regions and islands. Of the airports, 186 have paved runways, which improves connectivity as they will be able to handle larger planes and more services. Internal air transport for freight and passengers is well developed, and most locations can be reached by air, which is important for the more remote islands and areas that are not well served by roads, such as South Sumatra, West Papua and Kalimantan. Internal air transport for both freight and passengers is well developed, and most locations can be reached by air, which is important for more remote islands and areas that are not well served by roads, such as South Sumatra, West Papua and Kalimantan. The main airport is Soekarno-Hatta International in Jakarta, with other international airports at Surabaya, also on the island of Java, Denpasar in Bali, Medan in northern Sumatra, and Makassar on Sulawesi. There are also numerous smaller airports serving more remote regions, some of which offer international flights to regional air transport hubs such as Perth, Singapore and Kuala Lumpur, as well as domestic services. Indonesia's international airline connectivity, in terms of both passenger and freight transport, is very good. Direct international flights are available to a range of Asian, Middle Eastern and European cities, including Tokyo, Beijing, Seoul, Taipei, Hong Kong, Manila, Bangkok, Sydney, Jeddah, Doha, Dubai, Amsterdam, Paris, Frankfurt and Moscow. Airlines include Air Asia, Air France, Cathay Pacific, Emirates, Japan Airlines, KLM and Virgin Australia. International freight services are available from Jakarta SoekarnoHatta and Medan Kuala Namu to various destinations including Singapore, Hong Kong, Bangkok, Abu Dhabi, Paris and Amsterdam. Shipping Indonesia suffers from a problem of quantity over quality in terms of its ports and inland waterways. Supply chains in the country are heavily reliant on maritime trade due to its geographical composition, and consequently there are a great many ports serving the various islands. Indonesia also benefits from vast inland waterways, which are used to supply more remote areas of Kalimantan, Sumatra and Papua, where there are fewer roads and no railways. However, the quality of port infrastructure in the country is subTHIS COMMENTARY IS PUBLISHED BY FITCH SOLUTIONS COUNTRY RISK & INDUSTRY RESEARCH and is NOT a comment on Fitch Ratings' Credit Ratings. Any comments or data included in the report are solely derived from Fitch Solutions Country Risk & Industry Research and independent sources. Fitch Ratings analysts do not share data or information with Fitch Solutions Country Risk & Industry Research.
EMISPDF in-beroe04 from 137.97.88.22 on 2021-07-20 11:15:35 BST. DownloadPDF. fitchsolutions.com Downloaded by in-beroe04 from 137.97.88.22 at 2021-07-20 11:15:35 BST. EMIS. Unauthorized Distribution Prohibited.
26
Indonesia Freight Transport & Shipping Report | Q2 2021
standard, leading to long delays and increased costs for importers and exporters. Indonesia relies on maritime transport for connections between the multitude of islands in the archipelago. Major ports on Java include Tanjung Priok in Jakarta, Tanjung Perak in Surabaya, Tanjung Emas in Semarang and Tamjung Intan in Cilacap. In Sumatra Palembang river port, Padang and Belawan are the main terminals, while Kalimantan is served by ports at Banjarmasin, Pontianak and Balikpapan. There is also Makassar on Sulawesi Island and Sorong in Papua. Smaller sea and river ports abound in the archipelago, which are more reliant on transhipment from the main ports in the country. Stretching to 21,579km, Indonesia's inland waterways are the third longest in East and South East Asia, after China and Vietnam. Inland waterways are mostly located on Indonesian Borneo, Sumatra and Papua. Supply chains are affected by their poor infrastructure. There are severe issues with congestion and lack of adequate facilities that affect all the ports in the country. Indonesia's ports have suffered from perennial underinvestment and are perceived as highly inefficient. For example, the Port of Tanjung Priok is responsible for the majority of Indonesia's international maritime trade but suffers from severe issues with congestion because it is operating above capacity. The congestion at the port limits international trade as shipping companies are deterred from using it as a direct port of call. This increases reliance on transhipments from less congested and higher quality ports in other countries, such as Malaysia and Singapore, and adds further delays and costs to the supply chain. INDONESIA - MAJOR PORTS TONNAGE THROUGHPUT Geography Indonesia
Indicator
2019
2020e
2021f
2022f
2023f
2024f
Port of Tanjung Priok tonnage throughput, tonnes '000
25,642
22,317
22,923
23,529
24,168
24,843
Indicator
2025f
2026f
2027f
2028f
2029f
2030f
Port of Tanjung Priok tonnage throughput, tonnes '000
25,554
26,305
27,097
27,933
28,815
29,747
e/f = Fitch Solutions estimate/forecast. Source: Port authority, Fitch Solutions
INDONESIA - MAJOR PORTS TONNAGE THROUGHPUT Geography Indonesia
f = Fitch Solutions forecast. Source: Port authority, Fitch Solutions
Trade Indonesia is a relative underperformer in the East and South East Asian region in terms of the ease of trading across its borders from both an export and import perspective. While the time involved in exporting goods out of the country falls just below the regional average, importing is a more arduous and time-consuming affair. This is largely because the country employs a highly protectionist trade regime in order to boost private consumption levels of domestically produced goods and to shield local manufacturers from outside competition. The costs of trading across Indonesia's borders, together with low levels of connectivity, mean that it is uncompetitive on an East and South East Asian scale. First, due to the fact that Indonesia is an archipelago, getting goods from one part of the country to another involves a multi-modal supply chain that is both extremely time-consuming and cost-heavy. Second, although the cost of getting goods out of the country is below the regional average, due to the country's highly protectionist trade regime the cost of importing goods is higher than the regional average, owing to extra border and documentary requirements. All of Indonesia's main importing partners are located within the Asian region, and benefit from FTA's with the country – with the exception of the US. In 2018 Indonesia's main importing partners were China (15.1% of total product imports), Japan (10.8%), the US (10.2%), India (7.6%) and Singapore (7.2%). Thailand (5.8% of total product imports) and the US (5.4% of total product imports). These five nations have increased their representation within the Indonesian market between 2017 and 2018, with Jakarta’s import profile growing increasingly concentrated among these players – each country witnessed their share of the Indonesian market grow over the year. Despite the numerous advantages which these countries enjoy when trading with Indonesia as a result of these regional and bilateral FTAs, Indonesia's government still employs a heavily protectionist import regime to shield local industries from having to compete with products from other countries (especially manufactured goods). Therefore, despite Indonesia's strong appeal as an import destination for these and for other East and South East Asian nations, this comes with significant operational THIS COMMENTARY IS PUBLISHED BY FITCH SOLUTIONS COUNTRY RISK & INDUSTRY RESEARCH and is NOT a comment on Fitch Ratings' Credit Ratings. Any comments or data included in the report are solely derived from Fitch Solutions Country Risk & Industry Research and independent sources. Fitch Ratings analysts do not share data or information with Fitch Solutions Country Risk & Industry Research.
EMISPDF in-beroe04 from 137.97.88.22 on 2021-07-20 11:15:35 BST. DownloadPDF. fitchsolutions.com Downloaded by in-beroe04 from 137.97.88.22 at 2021-07-20 11:15:35 BST. EMIS. Unauthorized Distribution Prohibited.
27
Indonesia Freight Transport & Shipping Report | Q2 2021
risks. Indonesia has a limited number of free trade agreements that are active outside of those that it has as being a member of the ASEAN bloc. The country has a lesser dependence on international trade as its economic growth model is inward looking, driven by domestic consumption and government-led development. As a result, trade between Indonesia and non-ASEAN members is bound to be costly and subject to excessive bureaucracy. This undermines Indonesia's trade and investment openness. Many bilateral trade and investment agreements involving Indonesia usually get stuck in the negotiation process, take a long time to be concluded and/ or get signed but fails to enter into effect. For instance, Indonesia has either signed, proposed or initiated discussions on free trade agreements with many countries such as Mozambique, Sri Lanka, the USA, Peru, Taiwan, and the Eurasian Economic Union, Nigeria. Nevertheless, these and many others have not entered into effect. We expect that the country will, however, be forced to become more open to trade over the medium-long term as its industrial production expands, which will force it to look outside for additional demand for goods and services. Overall, the low level of trade openness undermines Indonesia's growth and investment potential. INDONESIA FREIGHT MODE BREAKDOWN (2019-2024) Indicator
2019e
2020e
2021f
2022f
2023f
2024f
Air Freight Tonnes (000)
1,049.0
939.4
981.7
1,022.0
1,069.3
1,117.2
Rail freight tonnes ('000)
51,106.0
48,898.2
51,779.6
54,526.8
57,752.8
61,019.0
1,480,964
1,326,259
1,352,216
1,376,965
1,406,026
1,435,450
Road Freight Tonnes (000)
e/f = Fitch Solutions estimate/forecast. Source: National sources, Fitch Solutions
INDONESIA FREIGHT MODE BREAKDOWN (2024-2029) Indicator
2025f
2026f
2027f
2028f
2029f
2030f
Air Freight Tonnes (000)
1,168.1
1,223.8
1,284.4
1,347.2
1,413.7
1,484.2
Rail freight tonnes ('000)
64,485.5
68,286.8
72,417.2
76,694.5
81,228.4
86,034.5
1,466,677
1,500,921
1,538,130
1,576,662
1,617,505
1,660,801
Road Freight Tonnes (000)
f = Fitch Solutions forecast. Source: National sources, Fitch Solutions
THIS COMMENTARY IS PUBLISHED BY FITCH SOLUTIONS COUNTRY RISK & INDUSTRY RESEARCH and is NOT a comment on Fitch Ratings' Credit Ratings. Any comments or data included in the report are solely derived from Fitch Solutions Country Risk & Industry Research and independent sources. Fitch Ratings analysts do not share data or information with Fitch Solutions Country Risk & Industry Research.
EMISPDF in-beroe04 from 137.97.88.22 on 2021-07-20 11:15:35 BST. DownloadPDF. fitchsolutions.com Downloaded by in-beroe04 from 137.97.88.22 at 2021-07-20 11:15:35 BST. EMIS. Unauthorized Distribution Prohibited.
28
Indonesia Freight Transport & Shipping Report | Q2 2021
Company Profile Garuda Indonesia Cargo SWOT Analysis Strengths
• Garuda Indonesia Cargo enjoys a dominant position in the air freight market in a densely populated island archipelago, meaning it is well positioned for demand and revenue growth.
Weaknesses
• Indonesia's poor safety ranking by the Federal Aviation Administration means that Garuda Indonesia Cargo remains unable to significantly increase its service to and from the US.
Opportunities
• The positive consumer outlook for Indonesia bodes well for freight imports. • The company is building new alliances and looking to create more logistics partnerships in order to expand its growing cargo business.
Threats
• Rising fuel prices present a considerable threat to the airlines' bottom lines. • Garuda posted net losses in the first nine months of 2016 which, according to Garuda Indonesia President Director and Chief Executive Arif Wibowo, was owing to 'challenging conditions in the domestic aviation industry as consumers' purchasing power waned, which saw stagnated sales and lower revenue, while a weaker rupiah caused various costs to soar'.
Company Overview Garuda Indonesia Cargo, Garuda Indonesia's freight-carrying division, transports goods via both domestic and international flights. Cargo Garuda Indonesia operates from Jakarta Air Cargo Terminal in Soekarno-Hatta International Airport using Boeing 747-400F and Boeing 747-200SF aircraft. The carrier also uses belly space capacity on Garuda Indonesia's passenger aircraft. Garuda Indonesia Cargo has a delivery capacity of around 30 tonnes per day. Garuda Indonesia Cargo also has a warehouse for storing goods to be shipped and those that have arrived. The company's core business is to provide a comprehensive range of integrated cargo transport and logistics services. With its fully integrated and diverse transport services, it is capable of providing domestic and international customers with door-to-door or one-stop services. Since 2004, it has been publicly listed on the Hong Kong Stock Exchange. According to the company's website, Garuda Indonesia currently has 142 aircrafts, including Boeing 777-300ER, 737-800NG, Airbus A330-200, Airbus A330-300, AIrbus A330-900neo, CRJ1000 NextGen and ATR 72-600. As of 30 September 2018, the average age of Garuda Indonesia's aircrafts is 6.62 years. State-owned airline Garuda Indonesia flies passengers and cargo to more than 90 destinations worldwide. Indonesia's national flag carrier commands a more than 50% share of the domestic market and is expanding its range of international flights.
Latest Updates 2020 Garuda Indonesia Cargo saw cargo freight volumes contract in 2020 due to economic disruption caused by the global Covid-19 pandemic.
THIS COMMENTARY IS PUBLISHED BY FITCH SOLUTIONS COUNTRY RISK & INDUSTRY RESEARCH and is NOT a comment on Fitch Ratings' Credit Ratings. Any comments or data included in the report are solely derived from Fitch Solutions Country Risk & Industry Research and independent sources. Fitch Ratings analysts do not share data or information with Fitch Solutions Country Risk & Industry Research.
EMISPDF in-beroe04 from 137.97.88.22 on 2021-07-20 11:15:35 BST. DownloadPDF. fitchsolutions.com Downloaded by in-beroe04 from 137.97.88.22 at 2021-07-20 11:15:35 BST. EMIS. Unauthorized Distribution Prohibited.
29
Indonesia Freight Transport & Shipping Report | Q2 2021
In March, the company's CEO stated that the firm was in talks to secure credit from both domestic and international banks. The Association of Asia Pacific Airlines has called on regional governments to financially support struggling air carriers during the Covid-19 pandemic.
Strategy The company's growth strategy, maintained by low fuel costs and strong domestic demand is looking to take advantage of the development of its network in China and the Middle East with the addition of new aircraft and freight partners, strengthening both domestic and international expansion. Garuda Indonesia Cargo is currently expanding operations, along with some other budget carriers in the region, as it looks to capitalise on the rise of e-commerce in Asia and the rise in air freight opportunities that this affords. Over the next few decades, air freight is set to double in volumes handled in Asia and, to take advantage of this, Garuda is looking at establishing an airborne network that will connect numerous key islands in Malaysia. The company will halt any new aircraft deliveries for the next two to three years as the national flag carrier looks to consolidate its finances. Garuda is looking to increase its capacity by improving utilisation of its existing fleet, which will result in lower unit costs and higher efficiencies. Indonesia’s flag carrier has made the decision to cut unprofitable routes from its roster, as well as examine other cost-cutting exercises as part of a strategy to reverse large net losses.
Financial Results FY2019 The company reported a net profit of USD19.73mn for Q119. FY2018 The company posted a net profit of USD806,000 in FY18, up from a net loss of USD213.4mn a year earlier in a sharp turnaround. Revenues in 2018 came in at USD4.37bn, up from USD4.17bn a year earlier. FY2017 The company reported a net loss of USD213.4mn for the full year, largely on the back of higher fuel prices. Brent crude rose rapidly from about USD45.0/barrel in June 2017 to around USD65.0/barrel at the end of 2017, putting pressure on aircraft carriers globally.
THIS COMMENTARY IS PUBLISHED BY FITCH SOLUTIONS COUNTRY RISK & INDUSTRY RESEARCH and is NOT a comment on Fitch Ratings' Credit Ratings. Any comments or data included in the report are solely derived from Fitch Solutions Country Risk & Industry Research and independent sources. Fitch Ratings analysts do not share data or information with Fitch Solutions Country Risk & Industry Research.
EMISPDF in-beroe04 from 137.97.88.22 on 2021-07-20 11:15:35 BST. DownloadPDF. fitchsolutions.com Downloaded by in-beroe04 from 137.97.88.22 at 2021-07-20 11:15:35 BST. EMIS. Unauthorized Distribution Prohibited.
30
Indonesia Freight Transport & Shipping Report | Q2 2021
Indonesia Demographic Outlook Demographic analysis is a key pillar of our macroeconomic and industry forecasting model. Not only is the total population of a country a key variable in consumer demand, but an understanding of the demographic profile is essential to understanding issues ranging from future population trends to productivity growth and government spending requirements. The accompanying charts detail the population pyramid for 2019, the change in the structure of the population between 2019 and 2050 and the total population between 1990 and 2050. The tables show indicators from all of these charts, in addition to key metrics such as population ratios, the urban/rural split and life expectancy.
Population (1990-2050)
e/f = Fitch Solutions estimate/forecast. Source: World Bank, UN, Fitch Solutions
Indonesia Population Pyramid 2019 (LHS) & 2019 Versus 2050 (RHS)
Source: World Bank, UN, Fitch Solutions
THIS COMMENTARY IS PUBLISHED BY FITCH SOLUTIONS COUNTRY RISK & INDUSTRY RESEARCH and is NOT a comment on Fitch Ratings' Credit Ratings. Any comments or data included in the report are solely derived from Fitch Solutions Country Risk & Industry Research and independent sources. Fitch Ratings analysts do not share data or information with Fitch Solutions Country Risk & Industry Research.
EMISPDF in-beroe04 from 137.97.88.22 on 2021-07-20 11:15:35 BST. DownloadPDF. fitchsolutions.com Downloaded by in-beroe04 from 137.97.88.22 at 2021-07-20 11:15:35 BST. EMIS. Unauthorized Distribution Prohibited.
31
Indonesia Freight Transport & Shipping Report | Q2 2021
POPULATION HEADLINE INDICATORS (INDONESIA 1990-2025) Indicator
1990
Population, % y-o-y
2000
2005
2010
2015
2020e
2025f
1.39
1.35
1.35
1.28
1.07
0.91
Population, total, male, '000
91,096.4
105,853.8
113,592.4
121,820.5
130,132.8
137,717.9
144,436.6
Population, total, female, '000
90,317.0
105,660.0
112,697.1
120,013.7
128,250.4
135,805.8
142,653.1
181,413.4
211,513.8
226,289.5
241,834.2
258,383.3
273,523.6
287,089.6
1.01
1.00
1.01
1.02
1.01
1.01
1.01
Population, total, '000 Population ratio, male/female
e/f = Fitch Solutions estimate/forecast. Source: World Bank, UN, Fitch Solutions
KEY POPULATION RATIOS (INDONESIA 1990-2025) Indicator
1990
2000
2005
2010
2015
2020e
2025f
67.3
54.8
53.1
51.0
48.9
47.5
47.7
72,973.8
74,858.0
78,481.8
81,717.3
84,838.6
88,070.6
92,743.4
59.8
64.6
65.3
66.2
67.2
67.8
67.7
108,439.6
136,655.8
147,807.7
160,116.9
173,544.6
185,453.1
194,346.2
61.0
47.5
45.7
43.5
40.9
38.3
36.5
66,127.3
64,918.7
67,618.2
69,716.2
70,928.7
70,941.1
70,894.0
6.3
7.3
7.3
7.5
8.0
9.2
11.2
6,846.5
9,939.3
10,863.6
12,001.1
13,909.9
17,129.5
21,849.4
Dependent ratio, % of total working age Dependent population, total, '000 Active population, % of total population Active population, total, '000 Youth population, % of total working age Youth population, total, '000 Pensionable population, % of total working age Pensionable population, '000
e/f = Fitch Solutions estimate/forecast. Source: World Bank, UN, Fitch Solutions
URBAN/RURAL POPULATION & LIFE EXPECTANCY (INDONESIA 1990-2025) Indicator
1990
2000
2005
2010
2015
2020e
2025f
Urban population, % of total
30.6
42.0
45.9
49.9
53.3
56.6
59.8
Rural population, % of total
69.4
58.0
54.1
50.1
46.7
43.4
40.2
Urban population, '000
55,483.5
88,840.0
103,961.9
120,709.1
137,751.9
154,926.5
171,760.0
Rural population, '000
125,929.9
122,673.8
122,327.6
121,125.1
120,631.4
118,597.1
115,329.6
Life expectancy at birth, male, years
60.9
64.3
65.6
67.2
68.7
69.8
70.5
Life expectancy at birth, female, years
63.7
67.2
69.1
71.3
73.0
74.2
75.1
Life expectancy at birth, average, years
62.3
65.8
67.3
69.2
70.8
71.9
72.8
e/f = Fitch Solutions estimate/forecast. Source: World Bank, UN, Fitch Solutions
POPULATION BY AGE GROUP (INDONESIA 1990-2025) Indicator
1990
2000
2005
2010
2015
2020e
2025f
Population, 0-4 yrs, total, '000
22,253.2
21,305.4
22,258.1
23,172.9
24,427.8
23,658.3
23,109.6
Population, 5-9 yrs, total, '000
22,482.0
21,697.4
22,720.7
23,527.7
23,050.3
24,298.1
23,548.2
Population, 10-14 yrs, total, '000
21,392.1
21,915.9
22,639.4
23,015.6
23,450.7
22,984.7
24,236.2
Population, 15-19 yrs, total, '000
19,921.6
22,260.8
22,134.0
21,367.9
22,877.9
23,318.3
22,858.3
Population, 20-24 yrs, total, '000
18,039.0
20,956.5
20,987.2
20,414.3
21,144.4
22,653.3
23,096.9
Population, 25-29 yrs, total, '000
15,655.3
19,300.6
20,516.1
21,666.9
20,183.1
20,918.2
22,423.5
Population, 30-34 yrs, total, '000
13,190.4
17,445.7
18,781.5
20,206.3
21,431.3
19,973.2
20,709.9
Population, 35-39 yrs, total, '000
10,150.6
15,102.9
16,809.6
18,819.3
19,960.4
21,193.4
19,758.6
Population, 40-44 yrs, total, '000
7,921.2
12,632.7
14,479.1
16,799.5
18,530.8
19,680.7
20,914.5
Population, 45-49 yrs, total, '000
7,283.1
9,577.1
11,605.4
14,277.0
16,440.4
18,166.0
19,316.4
THIS COMMENTARY IS PUBLISHED BY FITCH SOLUTIONS COUNTRY RISK & INDUSTRY RESEARCH and is NOT a comment on Fitch Ratings' Credit Ratings. Any comments or data included in the report are solely derived from Fitch Solutions Country Risk & Industry Research and independent sources. Fitch Ratings analysts do not share data or information with Fitch Solutions Country Risk & Industry Research.
EMISPDF in-beroe04 from 137.97.88.22 on 2021-07-20 11:15:35 BST. DownloadPDF. fitchsolutions.com Downloaded by in-beroe04 from 137.97.88.22 at 2021-07-20 11:15:35 BST. EMIS. Unauthorized Distribution Prohibited.
32
Indonesia Freight Transport & Shipping Report | Q2 2021
Indicator
1990
2000
2005
2010
2015
2020e
2025f
Population, 50-54 yrs, total, '000
6,631.1
7,297.3
9,216.7
11,735.2
13,824.1
15,955.0
17,660.3
Population, 55-59 yrs, total, '000
5,452.0
6,474.1
7,427.2
8,627.9
11,169.7
13,200.1
15,273.4
Population, 60-64 yrs, total, '000
4,195.3
5,608.1
5,850.8
6,202.5
7,982.7
10,394.8
12,334.4
Population, 65-69 yrs, total, '000
2,896.0
4,277.0
4,518.4
4,758.5
5,495.3
7,136.4
9,353.4
Population, 70-74 yrs, total, '000
1,950.8
2,908.2
3,189.9
3,527.0
3,925.1
4,617.5
6,035.4
Population, 75-79 yrs, total, '000
1,238.7
1,650.4
1,817.7
2,048.1
2,586.2
2,956.9
3,524.8
Population, 80-84 yrs, total, '000
586.2
811.9
963.2
1,169.0
1,240.0
1,631.7
1,899.0
Population, 85-89 yrs, total, '000
150.3
245.6
310.5
404.6
526.6
593.1
802.5
Population, 90-94 yrs, total, '000
22.3
42.5
58.1
84.4
121.1
169.0
198.0
Population, 95-99 yrs, total, '000
2.0
3.5
5.5
9.0
14.9
23.2
33.7
Population, 100+ yrs, total, '000
0.1
0.2
0.2
0.5
0.9
1.6
2.5
e/f = Fitch Solutions estimate/forecast. Source: World Bank, UN, Fitch Solutions
POPULATION BY AGE GROUP % (INDONESIA 1990-2025) Indicator
1990
2000
2005
2010
2015
2020e
2025f
Population, 0-4 yrs, % total
12.27
10.07
9.84
9.58
9.45
8.65
8.05
Population, 5-9 yrs, % total
12.39
10.26
10.04
9.73
8.92
8.88
8.20
Population, 10-14 yrs, % total
11.79
10.36
10.00
9.52
9.08
8.40
8.44
Population, 15-19 yrs, % total
10.98
10.52
9.78
8.84
8.85
8.53
7.96
Population, 20-24 yrs, % total
9.94
9.91
9.27
8.44
8.18
8.28
8.05
Population, 25-29 yrs, % total
8.63
9.12
9.07
8.96
7.81
7.65
7.81
Population, 30-34 yrs, % total
7.27
8.25
8.30
8.36
8.29
7.30
7.21
Population, 35-39 yrs, % total
5.60
7.14
7.43
7.78
7.73
7.75
6.88
Population, 40-44 yrs, % total
4.37
5.97
6.40
6.95
7.17
7.20
7.29
Population, 45-49 yrs, % total
4.01
4.53
5.13
5.90
6.36
6.64
6.73
Population, 50-54 yrs, % total
3.66
3.45
4.07
4.85
5.35
5.83
6.15
Population, 55-59 yrs, % total
3.01
3.06
3.28
3.57
4.32
4.83
5.32
Population, 60-64 yrs, % total
2.31
2.65
2.59
2.56
3.09
3.80
4.30
Population, 65-69 yrs, % total
1.60
2.02
2.00
1.97
2.13
2.61
3.26
Population, 70-74 yrs, % total
1.08
1.37
1.41
1.46
1.52
1.69
2.10
Population, 75-79 yrs, % total
0.68
0.78
0.80
0.85
1.00
1.08
1.23
Population, 80-84 yrs, % total
0.32
0.38
0.43
0.48
0.48
0.60
0.66
Population, 85-89 yrs, % total
0.08
0.12
0.14
0.17
0.20
0.22
0.28
Population, 90-94 yrs, % total
0.01
0.02
0.03
0.03
0.05
0.06
0.07
Population, 95-99 yrs, % total
0.00
0.00
0.00
0.00
0.01
0.01
0.01
Population, 100+ yrs, % total
0.00
0.00
0.00
0.00
0.00
0.00
0.00
e/f = Fitch Solutions estimate/forecast. Source: World Bank, UN, Fitch Solutions
THIS COMMENTARY IS PUBLISHED BY FITCH SOLUTIONS COUNTRY RISK & INDUSTRY RESEARCH and is NOT a comment on Fitch Ratings' Credit Ratings. Any comments or data included in the report are solely derived from Fitch Solutions Country Risk & Industry Research and independent sources. Fitch Ratings analysts do not share data or information with Fitch Solutions Country Risk & Industry Research.
EMISPDF in-beroe04 from 137.97.88.22 on 2021-07-20 11:15:35 BST. DownloadPDF. fitchsolutions.com Downloaded by in-beroe04 from 137.97.88.22 at 2021-07-20 11:15:35 BST. EMIS. Unauthorized Distribution Prohibited.
33
Indonesia Freight Transport & Shipping Report | Q2 2021
Freight Transport & Shipping Methodology Industry Forecast Methodology
Our industry forecasts are generated using the best-practice techniques of time-series modelling and causal/econometric modelling. The precise form of model we use varies from industry to industry, in each case being determined, as per standard practice, by the prevailing features of the industry data being examined. Common to our analysis of every industry is the use of vector autoregressions, which allow us to forecast a variable using more than the variable's own history as explanatory information. For example, when forecasting oil prices, we can include information about oil consumption, supply and capacity. When forecasting for some of our industry sub-component variables, however, using a variable's own history is often the most desirable method of analysis. Such single-variable analysis is called univariate modelling. We use the most common and versatile form of univariate models: the autoregressive moving average model (ARMA). In some cases, ARMA techniques are inappropriate because there is insufficient historical data or data quality is poor. In such cases, we use either traditional decomposition methods or smoothing methods as a basis for analysis and forecasting. We mainly use OLS estimators and in order to avoid relying on subjective views and encourage the use of objective views, we use a 'general-to-specific' method. We mainly use a linear model, but simple non-linear models, such as the log-linear model, are used when necessary. During periods of 'industry shock', for example poor weather conditions impeding agricultural output, dummy variables are used to determine the level of impact. Effective forecasting depends on appropriately selected regression models. We select the best model according to various different criteria and tests, including but not exclusive to: • • • •
R2 tests explanatory power; adjusted R2 takes degree of freedom into account; Testing the directional movement and magnitude of coefficients; Hypothesis testing to ensure coefficients are significant (normally t-test and/or P-value); All results are assessed to alleviate issues related to autocorrelation and multicollinearity.
We use the selected best model to perform forecasting. Human intervention plays a necessary and desirable role in all of our industry forecasting. Experience, expertise and knowledge of industry data and trends ensure analysts spot structural breaks, anomalous data, turning points and seasonal features where a purely mechanical forecasting process would not.
Sector-Specific Methodology
There are a number of principal criteria that drive our forecasts for each transport variable: • GDP Growth As transport activity is heavily influenced by real GDP growth, this factor is examined to ascertain its relationship with overall trade THIS COMMENTARY IS PUBLISHED BY FITCH SOLUTIONS COUNTRY RISK & INDUSTRY RESEARCH and is NOT a comment on Fitch Ratings' Credit Ratings. Any comments or data included in the report are solely derived from Fitch Solutions Country Risk & Industry Research and independent sources. Fitch Ratings analysts do not share data or information with Fitch Solutions Country Risk & Industry Research.
EMISPDF in-beroe04 from 137.97.88.22 on 2021-07-20 11:15:35 BST. DownloadPDF. fitchsolutions.com Downloaded by in-beroe04 from 137.97.88.22 at 2021-07-20 11:15:35 BST. EMIS. Unauthorized Distribution Prohibited.
34
Indonesia Freight Transport & Shipping Report | Q2 2021
volumes. Projected GDP growth is calculated using our own macroeconomic and demographic forecasts. The level of port throughput activity is also influenced by real GDP growth. This is used to represent the level of demand in a country and movement in this indicator will indicate changes in net exports volumes, hence throughput volumes. • Real Trade Volumes The sum of imports and exports plays a particularly important role in developing countries with a small domestic industrial sector. The focus is on goods, as services do not employ transport. The volumes are forecast based on the following criteria: • Trends manifested through historical data; • The impact of future step changes to the economy (such as future membership of the EU or some other regional body). The port throughput forecasts consider historical trends in trade data and the impact of changes to the trade openness in an economy, such as sanctions or membership of trade unions. • External Factors External factors also influence the shipping throughput forecasts. These include the likelihood and impact of strikes at local port level, and future investment plans that aim to improve port capacity. Freight Transport Tonnage Estimates We aim to generate best estimate figures for freight transport for countries where raw data on freight tonnage is not published or accessible. The estimate for tonnage data integrates macroeconomic, country area, transport and infrastructure data into our model. A parent market is selected which represents the benchmark for the region, and we then use weighted scale factors to adjust the raw data of the parent to calculate estimated proxy figures for a given market. The three indicators for which we estimate tonnage data are road freight, rail freight and air freight. One indicator used in estimating for all three indicators is real GDP. This is the value of output for a given country adjusted for inflation. This is used to represent the size of an economy and the level of transport activity in a country. It is one of the main scale factors used when generating our estimates. The additional indicators used in freight tonnage estimations are given below: • Population: The number of people living in a country. The data is sourced from the UN and the World Bank. • Total road length: The total length of the road network in a given country. The data is sourced from the CIA World Factbook. • Country area: The sum of all land and water areas within international boundaries. The data is sourced from the CIA World Factbook. • Number of airports with paved runways: The number of airports with concrete or asphalt landing surfaces. The data is sourced from the CIA World Factbook. • Length of railways: The total length of the railway network in a country. The data is sourced from the CIA World Factbook. • Number of airline take-offs: The number of domestic registered carrier departures worldwide from a given country. The data is sourced from the World Bank. Road Freight Road freight tonnage data is estimated with parent market data, which is then scaled by a 25% weighting for real GDP, 25% for population and 50% for total length of roads. THIS COMMENTARY IS PUBLISHED BY FITCH SOLUTIONS COUNTRY RISK & INDUSTRY RESEARCH and is NOT a comment on Fitch Ratings' Credit Ratings. Any comments or data included in the report are solely derived from Fitch Solutions Country Risk & Industry Research and independent sources. Fitch Ratings analysts do not share data or information with Fitch Solutions Country Risk & Industry Research.
EMISPDF in-beroe04 from 137.97.88.22 on 2021-07-20 11:15:35 BST. DownloadPDF. fitchsolutions.com Downloaded by in-beroe04 from 137.97.88.22 at 2021-07-20 11:15:35 BST. EMIS. Unauthorized Distribution Prohibited.
35
Indonesia Freight Transport & Shipping Report | Q2 2021
The population in a country represents demand for goods and thus the size of the road freight market. The total length of the road network determines how much freight can be carried by heavy trucks and goods vehicles.
Rail Freight Rail freight tonnage data is estimated with parent market data, which is then scaled by a 25% weighting for real GDP, 25% for country area and 50% for length of railways. The length of railways and the country's size will determine the demand and capacity to carry rail freight. A large country with an active railway network will likely use this to move greater volumes of goods over long distances. Air Freight Air freight tonnage data is estimated with parent market data, which is then scaled by a 25% weighting for real GDP, 50% for number of airline take-offs and 25% for number of airports with paved runways. The number of domestic airline take-offs is used to represent how active the airline market is in the country. Airports with paved runways indicate that a country is able to accommodate larger planes which carry goods. Sources Sources used in Freight Transport & Shipping reports include local transport ministries, officially released company results and figures, established think tanks and institutes and donor agencies such as the World Bank and the Asian Development Bank. For shipping tonnage and container data we source information from port authorities, officially released shipping company performance reports, and established port news reports and articles.
THIS COMMENTARY IS PUBLISHED BY FITCH SOLUTIONS COUNTRY RISK & INDUSTRY RESEARCH and is NOT a comment on Fitch Ratings' Credit Ratings. Any comments or data included in the report are solely derived from Fitch Solutions Country Risk & Industry Research and independent sources. Fitch Ratings analysts do not share data or information with Fitch Solutions Country Risk & Industry Research.
EMISPDF in-beroe04 from 137.97.88.22 on 2021-07-20 11:15:35 BST. DownloadPDF. fitchsolutions.com Downloaded by in-beroe04 from 137.97.88.22 at 2021-07-20 11:15:35 BST. EMIS. Unauthorized Distribution Prohibited.
36
Fit Fitch ch Solutions, 30 North C Colonnade olonnade,, Canary W Wharf harf,, L London. ondon. E14 5GN, UK Tel: +44 (0)20 7248 0468 Fax: +44 (0)20 7248 0467 Web: www.fitchsolutions.com
IS ISSN: SN: 2397-3951 Cop opy y Deadline: January 2021
© 20 2021 21 Fit Fitch ch Solutions Gr Group oup Limit Limited. ed. All rights rreserv eserved. ed.
All information, analysis, forecasts and data provided by Fitch Solutions Group Limited is for the exclusive use of subscribing persons or organisations (including those using the service on a trial basis). All such content is copyrighted in the name of Fitch Solutions Group Limited and as such no part of this content may be reproduced, repackaged, copied or redistributed without the express consent of Fitch Solutions Group Limited.
All content, including forecasts, analysis and opinion, has been based on information and sources believed to be accurate and reliable at the time of publishing. Fitch Solutions Group Limited makes no representation of warranty of any kind as to the accuracy or completeness of any information provided, and accepts no liability whatsoever for any loss or damage resulting from opinion, errors, inaccuracies or omissions affecting any part of the content.
This report from Fitch Solutions Country Risk & Industry Research is a product of Fitch Solutions Group Ltd, UK Company registration number 08789939 (‘FSG’). FSG is an affiliate of Fitch Ratings Inc. (‘Fitch Ratings’). FSG is solely responsible for the content of this report, without any input from Fitch Ratings. Copyright © 2021 Fitch Solutions Group Limited.
EMISPDF in-beroe04 from 137.97.88.22 on 2021-07-20 11:15:35 BST. DownloadPDF. Downloaded by in-beroe04 from 137.97.88.22 at 2021-07-20 11:15:35 BST. EMIS. Unauthorized Distribution Prohibited.