![Tugas Minitab [PDF]](https://pdfs.asia/img/200x200/tugas-minitab.jpg)
10 0 725 KB
TUGAS MINITAB Save folder dengan format:
“Tugas Rancob Kelas (A/B/C)_NRP_Kode soal” Dikirim ke [email protected] Batas pengumpulan Tugas: Kelas A : Selasa/ 19 Desember 2017 – sebelum Pk. 17.00 Kelas B : Rabu/ 20 Desember 2017 – sebelum Pk. 17.00 Kelas C : Kamis/ 21 Desember 2017 – sebelum Pk. 19.00 Bagi yang mengumpulkan tugas telat, maka dianggap tidak mengerjakan dan nilai tugas terakhir sama dengan nol.
A 1.
2.
Suatu industri farmasi memproduksi Terdapat 6 mesin yang berbeda dalam industri tablet salut enteric dengan menggunakan 3 fasilitas yang berbeda, yakni fasilitas A, fasilitas karet yang diuji dengan empat kali iterasi sehingga B, dan fasilitas C. Sampel-sampel diambil secara didapatkan data sebagai berikut; periodic. Sebanyak 15 sampel tablet diambil dan beratnya ditimbang. Hasilnya adalah Mesin sebagai berikut: Iterasi Iterasi 1 2 3 4 5 6 7 8 9 10 11 12 13 14 15
A 277,3 280,3 279,1 275,2 273,6 276,7 281,7 278,7 278,4 272,9 274,7 276,8 269,1 276,3 273,1
Fasilitas B 271,6 274,8 271,2 277,6 274,5 275,7 276,1 275,9 275,5 274 274,9 269,2 283,2 280,6 274,6
C 275,5 274,2 267,5 274,2 270,5 284,4 275,6 277,1 272,3 273,4 275,1 273,7 268,7 275 268,3
Apakah ada perbedaan berat tabel antara 3 fasilitas?
1 2 3 4
I 17,5 16,9 15,8 18,6
II 16,4 19,2 17,7 15,4
III 20,3 15,7 17,8 18,9
IV 14,6 16,7 20,8 18,9
V 17,5 19,2 16,5 20,5
VI 18,3 16,2 17,5 20,1
Apakah ada perbedaan antara 6 mesin berdasarkan data diatas?
B 2. Terdapat 5 macam brand obat nyamuk yang diuji dengan 5 kali iterasi sehingga didapatkan data sebagai berikut;
Iterasi
Brands A
B
C
D
E
1
5,2
9,1
3,2
2,4
7,1
2
4,7
7,1
5,8
3,4
6,6
3
8,1
8,2
2,2
4,1
9,3
4
6,2
6
3,1
1
4,2
5
3
9,1
7,2
4
7,6
Apakah ada perbedaan antara 5 jenis brand berdasarkan data diatas?
C 2. Terdapat 4 grup percobaan dengan 10 tanaman yang diuji dalam suatu laboratorium sehingga didapat data sebagai berikut;
Grup A
B
C
D
13,2
12,4
16
12,6
7,8
14,4
21
14,8
12,8
17,2
14,8
13
20
15,8
19,1
15,8
13
14
14
23,6
17
27
18
26
14,2
21,6
14
17
19,6
18
21,1
22
15
20
22,2
24,4
20,2
23,2
25
18,2
Apakah ada perbedaan antara 4 grup berdasarkan data diatas?
A
3.
An experiment was performed to determine the effect of four different chemicals on the strength of fabric and five fabric samples were selected. Test the differences in means using an Anova with 𝛼 = 0,05
4.
Corrosion fatigue in metals has been defined as the stimultaneous action of cyclic stress and chemical attact on a metal structure. A widely used technique for minimizing corrosion fatigue damage in aluminium involves the application of a protective coating. Test for significant main and interaction using anova with 𝛼 = 0,05 and the corrosion fatigue data, expressed in thousands of cycles to failure, were recorded as follows;
Fabric Sample
Chemical type
1
2
3
4
5
1
0,7
0,8
0,8
0,9
1
2
0,8
0,8
0,9
0,9
1
3
0,9
1
1,7
2
4
4
1
1,5
2
3
20
Relative Humidity
Coating
Uncoated
Anodized
Conversion
Low
Medium
High
361
469
314
522
1344
1216
466
937
244
739
1027
1097
1069
1357
261
134
1011
1011
114
1032
322
471
78
466
1236
92
306
130
387
107
533
211
68
398
130
327
130
1482
252
874
586
524
841
52
105
755
402
751
1595
754
847
573
846
529
B
5.
An experiment that determined the effect of four different type of tips in a hadrness tester on the observed hardness of a metal alloy. Four specimens of the alloy were obtained, and each tip was tested once on specimen, producing the following data:
Type of tip 1 2 3 4
1 9,3 9,4 9,2 9,7
Specimen 2 3 9,4 9,6 9,3 9,8 9,4 9,5 9,6 10
4 10 9,9 9,7 10,2
Test the different specimen and the type of tip using anova with 𝛼 = 0,01
C
5.
An article in the American Industrial Hygiene Association Journal describes a field
test for detecting the presence of arsenic in urine samples. The experiment compared the test as performed by both a trainee and an experienced trainer to an analysis at a remote laboratory. The response variable is arsenic content (in ppm) in the sebuject’s urine. Test the difference in the arsenic test procedure using anova with 𝛼 = 0,01 The data are as follows:
Test
Subject 1
2
3
4
Trainee
0,05
0,05
0,04
0,15
Trainer
0,05
0,05
0,04
0,17
Lab
0,04
0,04
0,03
0,1
A5 An engineer is interested in the effect of cutting speed (A), metal hardness (B), and cutting angle (C) on the life of a cutting tool. Two levels of each factor are chosen, and two replicates of a 23 factorial design are run. Analyze the data from this experiment using Anova if the tool life data (in hours) are shown in the following table: Treatment Combination (1) a b ab c ac bc abc
Replicate
I 221 325 354 552 440 406 605 392
II 311 435 348 472 453 377 500 419
A6 In Myers, Montgomery, and Anderson-Cook (2009), a data set is discussed in which a 23 factorial is used by an engineer to study the effect of cutting speed (A), tool geometry (B), and cutting angle (C) on the life (in hours) of a machine tool. Two levels of each factor are chosen, and duplicates are run at each design point with the order of the run at each design point with the order of the runs being random. Analyze this study using Anova. The data are presented here
Life (1) a b c ab ac bc abc
1 22 32 35 35 44 40 60 39
2 31 43 34 47 45 37 50 41
A7 In experiment conducted by the Mining Engineering Department at Virginia Tech to study a particular filtering system for coal, a coagulant was added to a solution in a tank containing coal and sludge, which was then placed in a recirculation system in order that the coal could be washed. Three factors were varied in experimental process: Factor A: percent solids circulated initially in the overflow Factor B:
flowrate of the polymer
Factor C:
pH of the tank
The amount of solids in the underflow of the cleansing system determines how clean the coal has become. Two levels of each factor were used two experimental runs were made for each of the 23 = 8 combinations. Analyze this experiment using Anova. The response measurements in percent solids by weight in the underflow of the circulation system are specified in the following table:
Treatment Combination
Response
(1)
a
b
c
ab
ac
bc
abc
1
4,65
21,42
12,66
7,93
18,27 13,18 6,51 18,23
2
5,81
21,35
12,56
7,88
16,62 12,87 6,26 17,83
A8 In an experiment conducted at the Departement of Mechanical Engineering. Six factor are rpm A, temperature B, gap between blade C, gap between blade and casing D, location of input E, and location of detection F. A ¼ fraction of a 26 factorial experiments is used, with defining contrasts being ABCE and BCDF. The data are as follows:
A -1 1 -1 1 -1 1 -1 1 -1 1 -1 1 -1 1 -1 1
B -1 -1 1 1 -1 -1 1 1 -1 -1 1 1 -1 -1 1 1
C -1 -1 -1 -1 1 1 1 1 -1 -1 -1 -1 1 1 1 1
D -1 -1 -1 -1 -1 -1 -1 -1 1 1 1 1 1 1 1 1
E -1 1 1 -1 1 -1 -1 1 -1 1 1 -1 1 -1 -1 1
F -1 -1 1 1 1 1 -1 -1 1 1 -1 -1 -1 -1 1 1
Perform an analysis of variance on main effects and use a = 0,05.
Response 3,89 10,46 25,98 39,88 61,88 3,22 8,94 20,29 32,07 50,76 2,8 8,15 16,8 25,47 44,44 2,45
A9 An article in the Journal of Quality Technology describes the use of a replicated fractional to investigate the effect of five factors on free height of leaf . The factors are A= furnace temperature, B: heating time, C: transfer time, D: hold down time, E: oil temperature. The data are shown in the following table.
A -1 1 -1 1 -1 1 -1 1 -1 1 -1 1 -1 1 -1 1
B -1 -1 1 1 -1 -1 1 1 -1 -1 1 1 -1 -1 1 1
C -1 -1 -1 -1 1 1 1 1 -1 -1 -1 -1 1 1 1 1
D -1 1 1 -1 1 -1 -1 1 -1 1 1 -1 1 -1 -1 1
E -1 -1 -1 -1 -1 -1 -1 -1 1 1 1 1 1 1 1 1
7,78 8,15 7,5 7,59 7,54 7,69 7,56 7,56 7,5 7,88 7,5 7,63 7,32 7,56 7,18 7,81
Perform an analysis of variance on main effects and use a = 0,05.
Free Hight 7,78 8,18 7,56 7,56 8 8,09 7,52 7,81 7,56 7,88 7,56 7,75 7,44 7,69 7,18 7,5
7,81 7,88 7,5 7,75 7,88 8,06 7,44 7,69 7,5 7,44 7,5 7,56 7,44 7,62 7,25 7,59
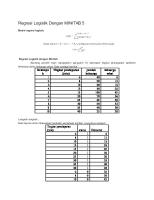
A 10 In the study Durability of Rubber to Steel Adhesively Bonded Joints measured the number of breakdowns in an adhesive seal. It was postulated that concentration of seawater A, temperature B, pH C, voltage D, and stress E influence the breakdown of adhesive seal. A ½ fraction of a 25 factorial experiment was used, with the defining contast being ABCDE. The data are as follows:
A -1 1 -1 1 -1 1 -1 1 -1 1 -1 1 -1 1 -1 1
B -1 -1 1 1 -1 -1 1 1 -1 -1 1 1 -1 -1 1 1
C -1 -1 -1 -1 1 1 1 1 -1 -1 -1 -1 1 1 1 1
D -1 -1 -1 -1 -1 -1 -1 -1 1 1 1 1 1 1 1 1
Perform an analysis of variance on main effects and use a = 0,05.
E Response 1 462 -1 746 -1 714 1 1070 -1 474 1 832 1 764 -1 1087 -1 522 1 854 1 773 -1 1068 1 572 -1 831 -1 819 1 1104